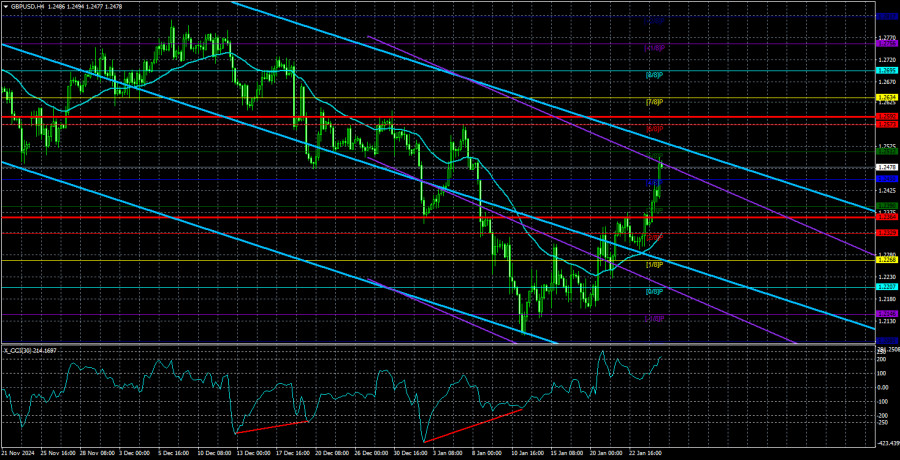
Juma kuni GBP/USD juftligi sezilarli o'sishni namoyish etdi. Bu harakatga Buyuk Britaniya va AQShdan kelgan PMI indekslari ta'sir ko'rsatgan bo'lsa-da, 150 punktlik o'sish faqat shu ma'lumotlarga asoslanganmi, degan savol tug'iladi. Ishlab chiqarish sektori PMI 48.2 ga ko'tarildi, bu 50.0 kritik chegaradan pastda qolmoqda (50 dan past har qanday ko'rsatkich qisqarishni bildiradi). Xizmatlar sektori PMI esa 51.1 dan 51.2 ga biroz ko'tarildi. Ma'lumotlar bir qarashda ijobiy ko'rinishi mumkin, ammo ular markaziy bank yig'ilishlaridan keyin kamdan-kam uchraydigan bunday keskin o'zgarishga sabab bo'lmagan ko'rinadi.
Bozor asosan uzoq davom etgan tuzatilish tufayli funt sotib olayotgan ko'rinadi. Bu nafaqat sterlingni sotib olishni, balki dollarning sotilishini ham anglatadi. Bu, ehtimol, Donald Trampning yaqin qarorlari bilan bog'liq. Yoki so'nggi 3,5 oydan beri ochilgan qisqa pozitsiyalardan foyda olish uchun sotuvchilar tomonidan qilingan harakat bo'lishi mumkin. Har qanday sabab bo'lishidan qat'i nazar, funtning uzoq muddatli barqaror o'sishi uchun kuchli asos ko'rinmayapti. 16 yillik pasayish trendi hamon davom etmoqda, va 4 oylik pasayish trendi hamon buzilgani yo'q. Kundalik grafikda so'nggi o'sish avvalgi pasayish bilan solishtirilganda kichikdir. Shuning uchun funt yana bir-ikki hafta o'sishda davom etishi mumkin bo'lsa-da, bu umumiy yoki qisqa muddatli pasayish tendensiyasini bekor qilmaydi.
Funt uchun keyingi o'sish qiyin kechishi kutilmoqda. Ushbu haftada Federal Rezerv 2025-yildagi birinchi yig'ilishini o'tkazadi va foiz stavkalari o'zgarmasligi deyarli kafolatlangan. Bunga qarshi ravishda, kelasi hafta Angliya Banki stavkalarni pasaytirishi kutilmoqda, va yil davomida qo'shimcha pasayishlar ham bo'lishi mumkin. Bu hafta Buyuk Britaniyada muhim iqtisodiy ma'lumotlar chiqishi kutilmayapti, chunki mamlakat iqtisodiy holati haqida yetarlicha ma'lumot allaqachon to'plangan va ijobiy xabarlar ko'p emas.
Biroq, AQShda hafta ancha band bo'ladi. Seshanba kuni barqaror tovarlarga buyurtmalar bo'yicha muhim hisobot chiqadi. Chorshanba kuni Federal Rezerv yig'ilishi yakunlanadi. Payshanba kuni yana bir muhim hisobot e'lon qilinadi. Juma kuni esa Shaxsiy iste'mol xarajatlari (PCE) narxlari indeksi e'lon qilinadi. To'rtinchi chorak uchun yalpi ichki mahsulot (YaIM) kuchli va barqaror natijalarni ko'rsatishi kutilmoqda. Shuningdek, Federal Rezerv foiz stavkalarini pasaytirishni rejalashtirayotgani haqida hech qanday ishora berayotgani yo'q.
Tramp Fed raisi Pauelga bosim o'tkazib, stavkalarni pasaytirishga undashni rejalashtirayotgani ham qayd etilmoqda. To'rt yil avval bo'lgani kabi, Tramp bu borada qat'iy turishi mumkin. Biroq, Fed bunga bo'ysunishidan qo'rqish uchun asos ko'rinmaydi. Tramp o'z rejalari uchun o'zi javobgar bo'ladi, Fed esa o'z vazifalarini mustaqil ravishda bajarishda davom etadi.
GBP/USD juftligi qisqa muddatda yana o'sishi mumkin bo'lsa-da, umumiy pasayish tendensiyasi hali o'zgargani yo'q. Bozor e'tibori ushbu haftadagi muhim AQSh ma'lumotlari va Federal Rezerv yig'ilishiga qaratilgan.

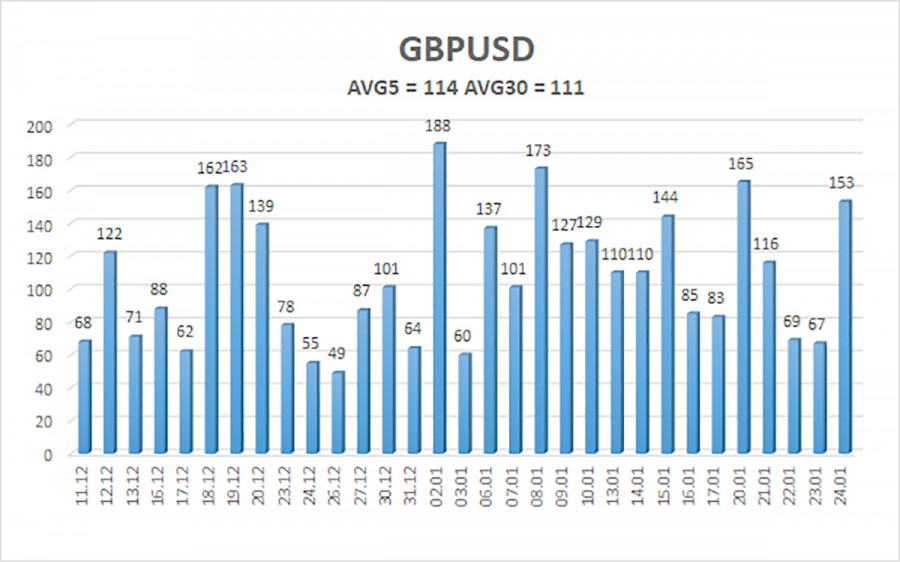
So'nggi besh savdo kunidagi GBP/USD juftligining o'rtacha volatilligi 114 punktni tashkil etadi, bu ushbu juftlik uchun "yuqori" hisoblanadi. Shunday qilib, dushanba, 27-yanvar kuni, juftlikning harakati 1.2364 va 1.2592 darajalar bilan chegaralangan diapazonda bo'lishi kutilmoqda. Yuqori chiziqli regressiya kanali pastga yo'naltirilgan bo'lib, bu pasayish trendini ko'rsatadi. CCI indikatori yaqinda haddan tashqari sotib olingan zona ichiga kirdi va ayiq divergentsiyasi shakllanishi mumkin, bu esa pasayish trendining qayta boshlanishini anglatishi mumkin.
Yaqin qo'llab-quvvatlash darajalari:
- S1 – 1.2451
- S2 – 1.2390
- S3 – 1.2329
Yaqin qarshilik darajalari:
- R1 – 1.2512
- R2 – 1.2573
- R3 – 1.2634
Savdo tavsiyalari:
GBP/USD juftligi pasayuvchi tendensiyada qolmoqda. Uzoq pozitsiyalar hozircha tavsiya etilmaydi, chunki Britaniya funti o'sishini ta'minlovchi barcha omillar bozorga to'liq narxlarga aks etdi va yangi kuchaytiruvchi katalizatorlar mavjud emas.
Agar siz faqat texnik tahlil asosida savdo qilsangiz, uzun pozitsiyalar harakatlanuvchi o'rtacha chiziqdan yuqorida barqaror narx sharoitida 1.2573 va 1.2592 ni maqsad darajalari sifatida ko'rib chiqilishi mumkin. Ammo qisqa pozitsiyalar juda ko'p ahamiyatli, 1.2207 va 1.2146 ni maqsad joylari sifatida. Ushbu pozitsiyalarni amaliyotga tatbiq etish uchun narxlar harakatlanuvchi o'rtacha chiziqdan pastroq barqarorlashishi kerak.
Illyustratsiyalarni tushuntirish:
Chiziqli regressiya kanallari joriy tendensiyasini aniqlashga yordam beradi. Agar ikkala kanal ham mos kelsa, bu kuchli tendensiyani bildiradi.
Harakatlanuvchi o'rtacha chiziq (sozlamalar: 20,0, silliq) qisqa muddatli tendensiyani belgilaydi va savdo yo'nalishini belgilaydi.
Murray darajalari harakat va tuzatishlar uchun maqsad darajalari vazifasini bajaradi.
Tebranish darajalari (qizil chiziqlar) joriy tebranish ko'rsatkichlari asosida juftlikning kelgusi 24 soatlik ehtimoliy narx oralig'ini ko'rsatadi.
CCI indikatori: Agar u haddan tashqari sotilgan hududga (–250 dan past) yoki haddan tashqari sotib olingan hududga (+250 dan yuqori) kirsa, bu qarama-qarshi yo'nalishda tendensiya teskari aylanishini signal qiladi.


