empty
 
 
26.02.2025 11:58 AM
GBP/USD – February 26th: A Month of Stability for Mexico and Canada is Coming to an End

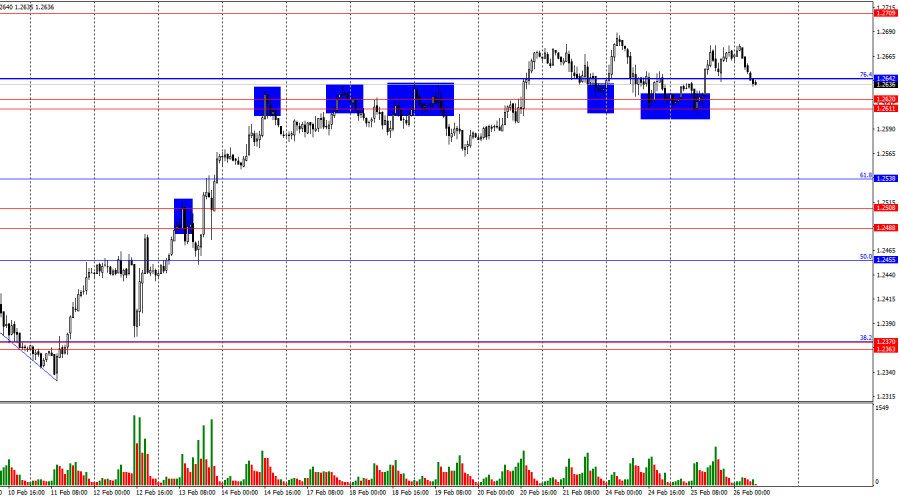
On the hourly chart, GBP/USD rebounded again from the support zone of 1.2611–1.2620 on Tuesday, showing a modest upward movement towards 1.2709. However, just like in the previous two attempts, bulls failed to reach the target. Today, another return to the 1.2611–1.2620 zone is possible. A new rebound from this area could support a slight rise in the pair. Conversely, a break below this zone would open the path for a decline towards the 61.8% Fibonacci retracement level at 1.2538.

This image is no longer relevant

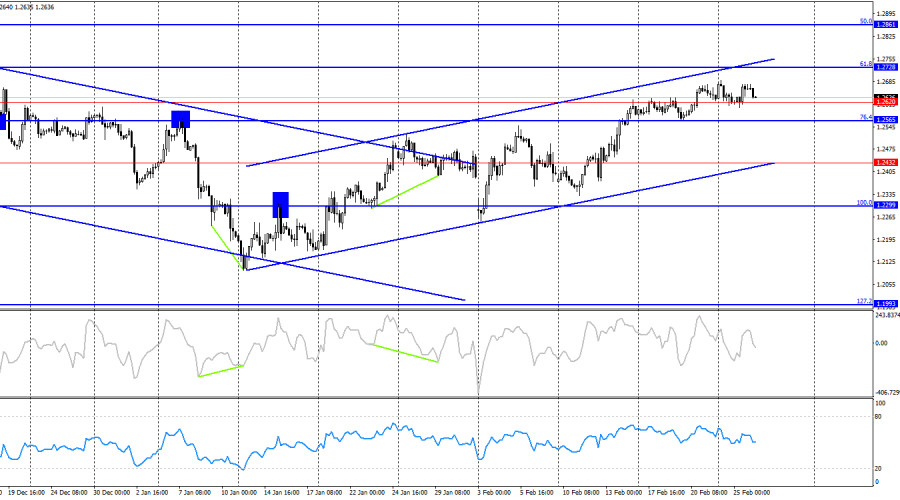
The wave structure remains clear. The last completed downward wave did not break the previous low, while the most recent upward wave surpassed the previous peak. This suggests that a bullish trend is still forming. However, recent waves have varied significantly in size, making the overall trend somewhat uncertain. While the GBP has demonstrated strong growth recently, it is unclear whether this trend will persist for another few weeks.

The lack of fundamental news on Tuesday led to a pause in trading activity. However, this pause may soon end, as the beginning of a new month approaches. This means that key U.S. labor market and unemployment data will be released soon. Additionally, next week marks the start of Donald Trump's tariffs on imports from Mexico and Canada. While these tariffs were delayed by one month, they are set to take effect on March 4.

As a result, next week is expected to be the complete opposite of this one—classic "calm before the storm." However, until then, GBP/USD may continue its horizontal movement, as traders hesitate to open new positions ahead of major economic reports and events.

This image is no longer relevant

On the 4-hour chart, GBP/USD continues to rise and has secured itself above the resistance zone at 1.2565–1.2620. This suggests that the uptrend may extend towards the 61.8% Fibonacci level at 1.2728. The ascending trend channel indicates a bullish sentiment, and no signs of divergence are present on any indicators. A significant decline in GBP/USD is only expected if the pair closes below the trend channel.

Commitments of Traders (COT) Report

This image is no longer relevant

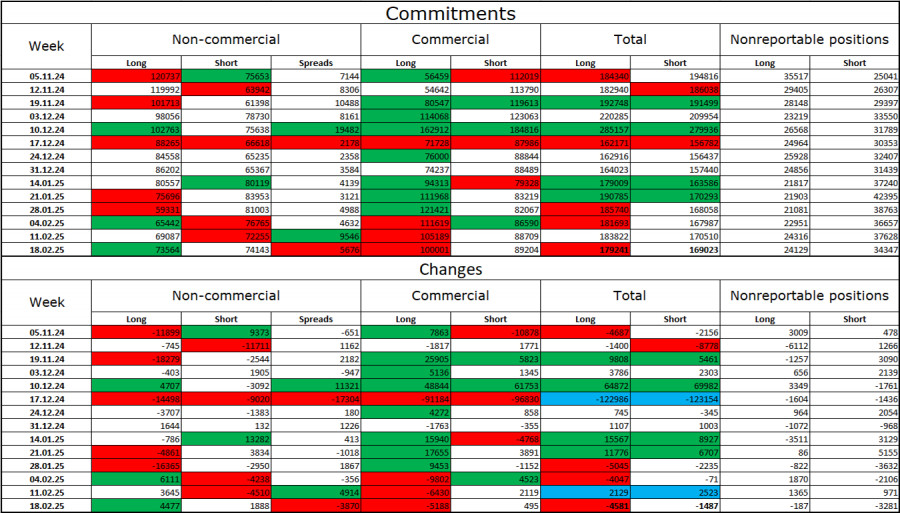
The sentiment of non-commercial traders in the latest COT report became less bearish. The number of long positions held by speculators increased by 4,477, while the number of short positions rose by only 1,888. Bulls have lost their market advantage, but bears have also struggled to increase their short positions. The gap between long and short positions is minimal—73,000 vs. 74,000, indicating an uncertain market direction.

From my perspective, the GBP remains vulnerable to further declines. The COT report suggests that bears are slowly but steadily strengthening their positions. Over the last three months, the number of long contracts has decreased from 120,000 to 73,000, while the number of short positions has remained stable at around 74,000.

This gradual unwinding of long positions indicates that institutional players may continue reducing their GBP holdings or increasing their short exposure, as most bullish factors for GBP have already been priced in. The temporary support for the pound came from positive UK economic data, but technical analysis still points to a continuation of the broader downtrend.

Economic Calendar for the UK and U.S.:

  • U.S. – New Home Sales Data (15:00 UTC)

Wednesday's calendar includes only one low-impact event. As a result, the news background is unlikely to significantly influence market sentiment for the remainder of the day.

GBP/USD Forecast and Trading Recommendations:

Sell positions could be considered if GBP/USD closes below the 1.2611–1.2620 zone on the hourly chart, with a target at 1.2538. Buying the pair is not advisable at the moment, as bulls are reluctant to push higher, and they lack strong momentum for a breakout. However, if GBP/USD remains above the 1.2611–1.2620 zone, another bullish attempt towards 1.2709 may be expected.

Fibonacci Levels Used for Analysis:

  • Hourly Chart: 1.2809 – 1.2100
  • 4-Hour Chart: 1.2299 – 1.3432
Gana con los cambios en el valor de las criptomonedas con InstaForex.
Descarga MetaTrader 4 y abre tu primera operación.
  • Grand Choice
    Contest by
    InstaForex
    InstaForex always strives to help you
    fulfill your biggest dreams.
    UNIRSE AL CONCURSO
  • Depósito al azar
    ¡Haga un depósito en su cuenta de $3,000 y obtenga $1000 más!
    ¡En Febrero, sorteamos $1000 dentro de la campaña Depósito afortunado!
    Obtenga la oportunidad de ganar depositando $3,000 en una cuenta de operaciones. Tras haber cumplido esta condición, se convertirá en un participante de la campaña.
    UNIRSE AL CONCURSO
  • Opere de forma inteligente, gane un dispositivo
    Recargue su cuenta con al menos $500, regístrese en el concurso y tenga la oportunidad de ganar dispositivos móviles.
    UNIRSE AL CONCURSO
  • 100% de bonificación
    Su oportunidad única de obtener un bono del 100 % en su depósito
    OBTENER BONO
  • 55% de bonificación
    Solicite un bono del 55% en cada depósito
    OBTENER BONO
  • 30% de bonificación
    Reciba un bono del 30% cada vez que recargue su cuenta
    OBTENER BONO

Recommended Stories

¿No puede hablar ahora mismo?
Ingrese su pregunta en el chat.
Widget callback