GBP/USD 5-Minute Analysis
The GBP/USD currency pair experienced significant volatility on Wednesday, similar to that of the EUR/USD pair. Looking at the hourly chart, the numerous price swings can be overwhelming. The market is currently chaotic, with erratic price movements dominating the landscape. We previously advised traders to avoid expecting clean, steady trends, even on lower timeframes. Nonetheless, the upward correction observed on the daily timeframe continues to push the pound higher.
The most notable event yesterday was the U.S. inflation report, which delivered clear and definitive results. Both core and headline inflation accelerated in January, diminishing any likelihood of a Federal Reserve rate cut in the near future. If Jerome Powell and the Fed were previously hesitant about cutting rates, this report has only strengthened their position.
From a technical standpoint, the trend for GBP/USD has shifted once again. A downward trendline was briefly established before being broken, which signals a new rally for the British currency. However, we have doubts that this bullish momentum will be strong or sustained. As mentioned earlier, the upward correction on the daily timeframe appears as a series of alternating trends on the hourly chart, and that's precisely what we are observing now. Each trader will need to decide for themselves whether to participate in such erratic and choppy price movements, understanding that this is simply a correction.
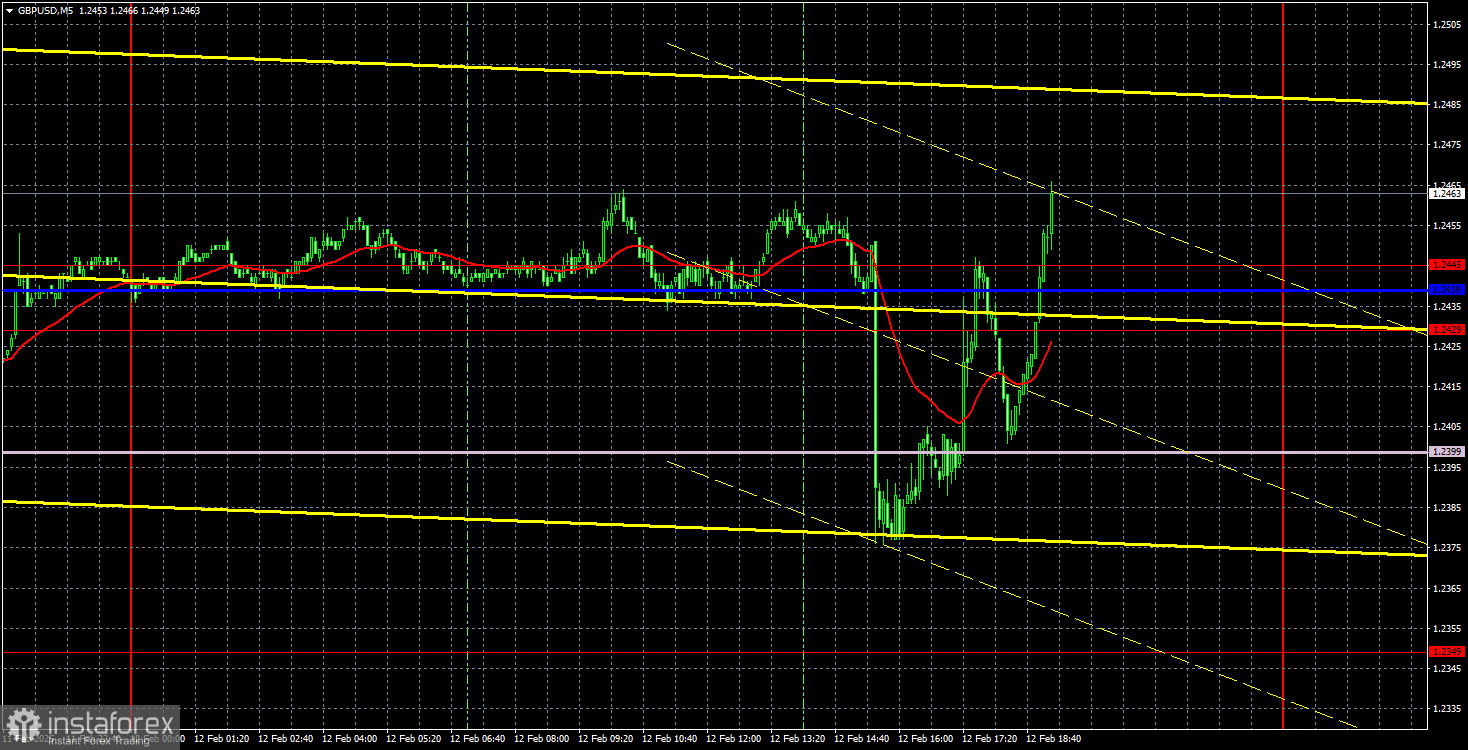
We did not even consider the trade signals on the 5-minute timeframe. The pair fell by 70 pips in just five minutes, only to bounce back by 100 pips over the next few hours. Most of the time, the price fluctuated within the 1.2399–1.2445 range, which contained four different technical levels and indicators. The market activity was chaotic and illogical, rendering trade executions based on signals ineffective. Regardless of the setup, any Stop Loss would need to be placed significantly far from the entry points, making risk management impractical.
COT Report
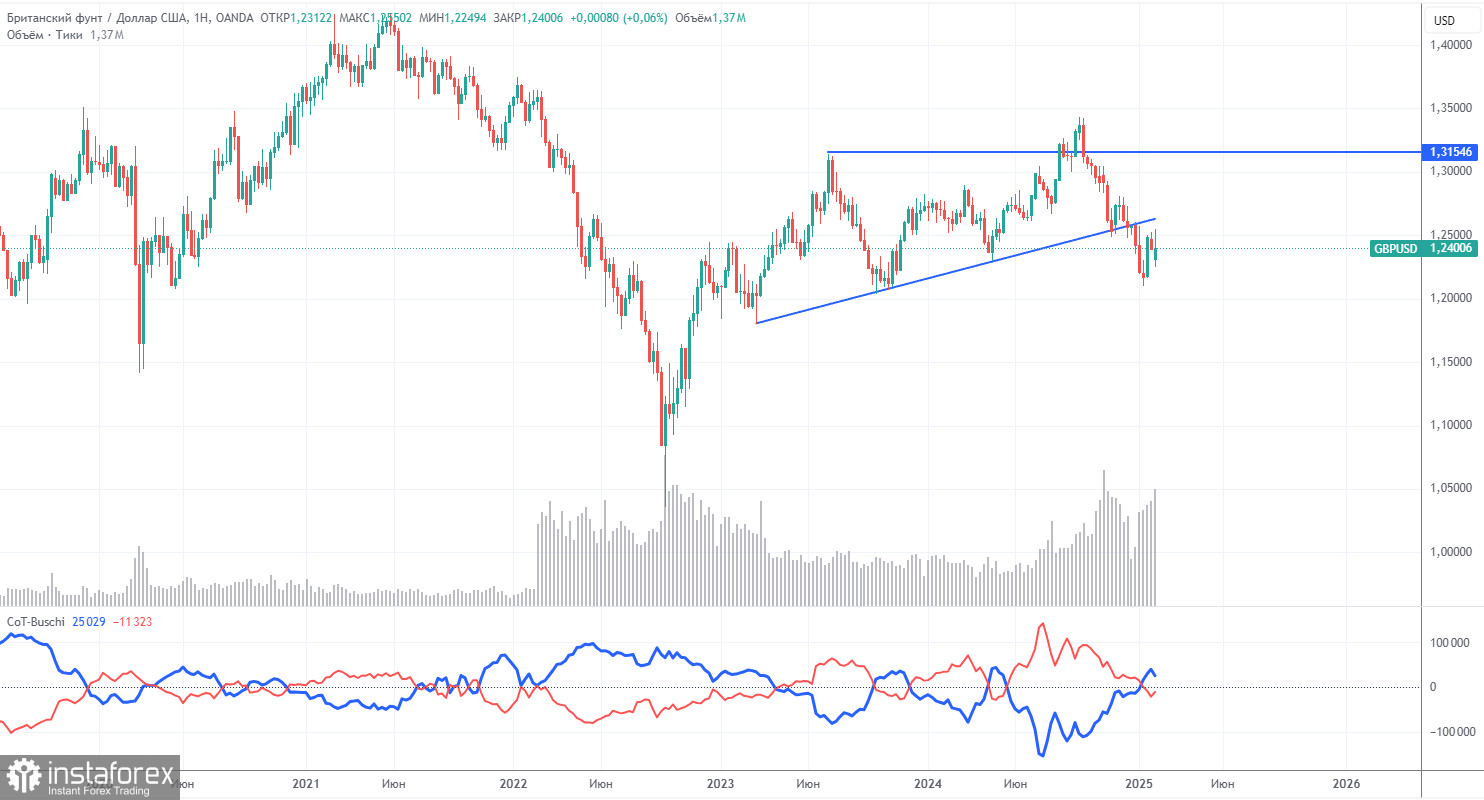
The COT reports for the British pound indicate that sentiment among commercial traders has been highly unstable over the past several years. The red and blue lines, which represent the net positions of commercial and non-commercial traders, frequently intersect and often hover near the zero mark. This suggests that buy and sell positions are nearly balanced at this time.
On the weekly timeframe, GBP/USD initially broke above the 1.3154 level but subsequently fell back to and breached the trendline. This break of the trendline strongly suggests that the pound is likely to continue its decline. However, a bounce from the previous local low on the weekly timeframe raises the possibility that the market may be entering a range-bound phase, characterized by flat movement.
According to the latest COT report, the Non-commercial group (large institutional traders) closed 16,400 long contracts and only 2,900 short contracts. As a result, the net position of non-commercial traders decreased by 13,500 contracts, which is a negative sign for the pound.
The fundamental backdrop continues to offer no justification for long-term purchases of GBP, and the currency remains at risk of resuming its broader downtrend. Therefore, the net position of non-commercial traders may continue to decline, indicating a further drop in demand for the British pound.
GBP/USD 1-Hour Analysis
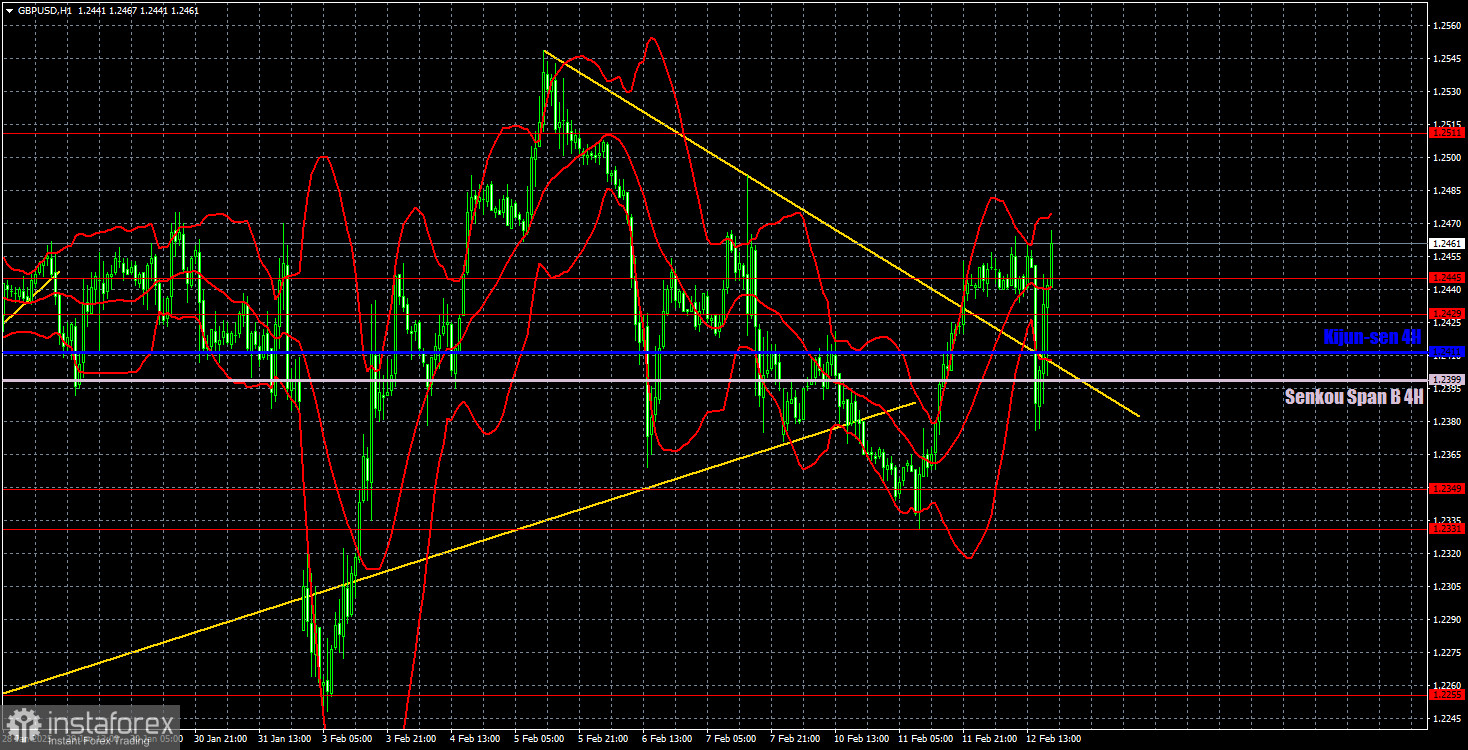
On the hourly timeframe, the GBP/USD currency pair has completed a short-term downward trend. However, this might not be the last in the ongoing sequence of alternating trends. We still do not see any fundamental basis for the British pound to sustain growth in the long term. From a higher timeframe and long-term perspective, we do not recommend taking long positions. The pound's position lacks fundamental stability, and any growth can only be attributed to short-term corrections.
For February 13, we highlight the following key levels: 1.2052, 1.2109, 1.2237-1.2255, 1.2331-1.2349, 1.2429-1.2445, 1.2511, 1.2605-1.2620, 1.2691-1.2701, and 1.2796-1.2816. The Senkou Span B (1.2399) and Kijun-sen (1.2411) lines may also serve as important indicators. It is recommended to set the Stop Loss level to breakeven once the price moves 20 pips in the desired direction. Please note that the Ichimoku indicator lines may change throughout the day, which should be taken into account when identifying trading signals.
On Thursday, the UK is set to release significant reports on GDP and industrial production. Yesterday, the pair experienced both declines and increases, and today could follow a similar pattern. It is unlikely that UK economic data will provide substantial support for the pound, while recent U.S. reports appear too weak to trigger a notable market reaction.
Illustration Explanations:
- Support and Resistance Levels (thick red lines): Thick red lines indicate where movement may come to an end. Please note that these lines are not sources of trading signals.
- Kijun-sen and Senkou Span B Lines: Ichimoku indicator lines transferred from the 4-hour timeframe to the hourly timeframe. These are strong lines.
- Extreme Levels (thin red lines): Thin red lines where the price has previously bounced. These serve as sources of trading signals.
- Yellow Lines: Trendlines, trend channels, or any other technical patterns.
- Indicator 1 on COT Charts: Represents the net position size for each category of traders.