GBP/USD 5-Minute Analysis
The GBP/USD currency pair experienced a sharp decline on Thursday but began to recover quickly. As we mentioned yesterday, the Bank of England's meeting was likely to trigger a drop in the value of the British currency. However, we anticipated that this decline would be short-lived, as the correction on the daily timeframe still appeared relatively weak.
The BoE decided to cut the key interest rate by 0.25%, with all nine members of the Monetary Policy Committee voting in favor of this move. Andrew Bailey remarked that monetary policy easing would continue, despite the potential for rising inflation, indicating that the BoE is increasingly concerned about sluggish economic growth. Additionally, the BoE revised its GDP forecasts downward for both this year and the next. These factors provided ample reasons for the pound to decline.
Nonetheless, the British currency could continue to appreciate in the near term. Today's price movements will heavily depend on U.S. labor market and unemployment data. However, the technical setup remains quite clear. We previously noted that impulsive and emotional market moves—like the downward plunge observed on Monday—should often be overlooked. When the price broke the ascending trendline, traders rushed to sell the pound; however, this breakout turned out to be false. Yesterday, the pair perfectly retested the trendline and now has the potential to resume its upward movement.
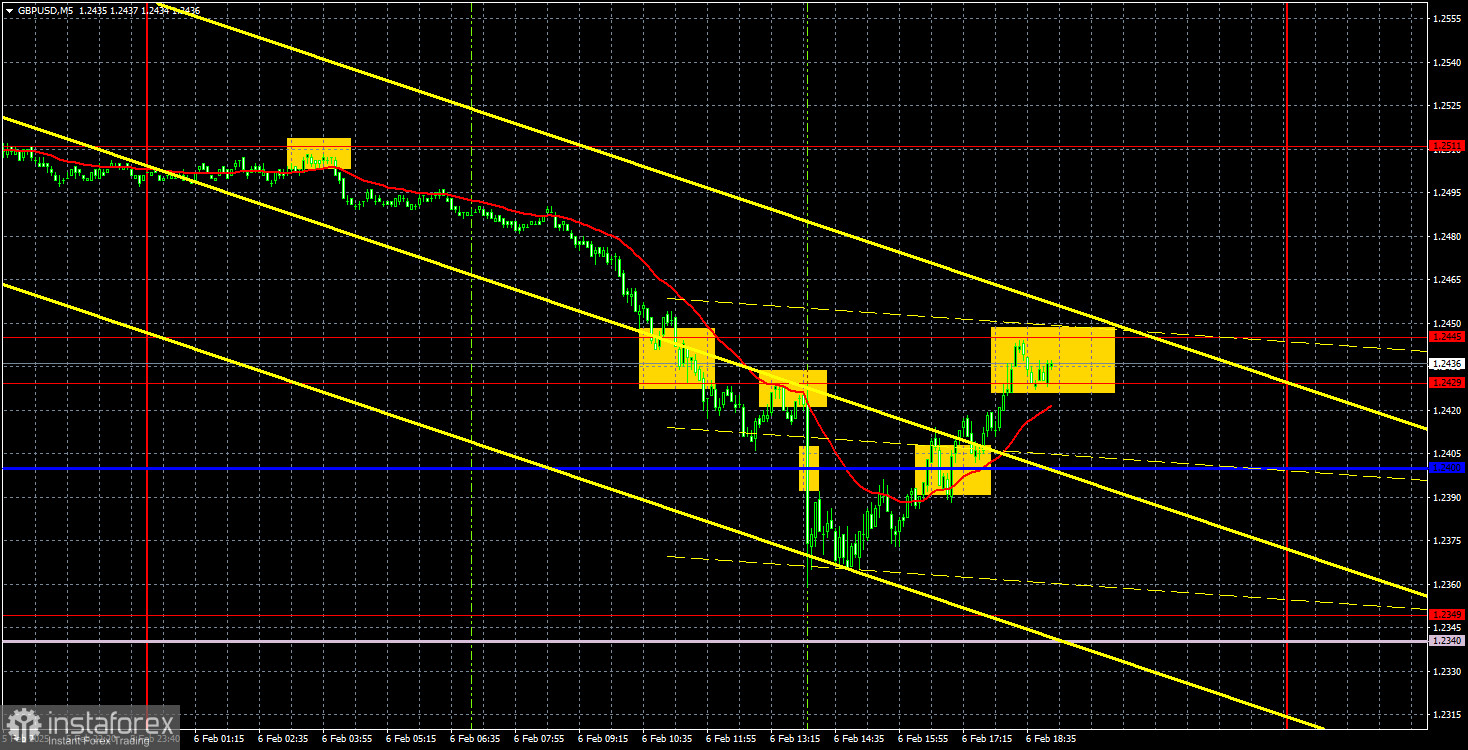
In terms of Thursday's trading signals, there was only a slight overnight rebound from 1.2511. Later, during the European session, the price fell to the 1.2429–1.2445 zone. Traders could have closed short positions before the BoE's announcement to secure solid profits, or alternatively, set a Stop Loss at breakeven. The price then became constrained between the 1.2340-1.2349 and 1.2400-1.2445 zones, making trading within this range impractical.
COT Report
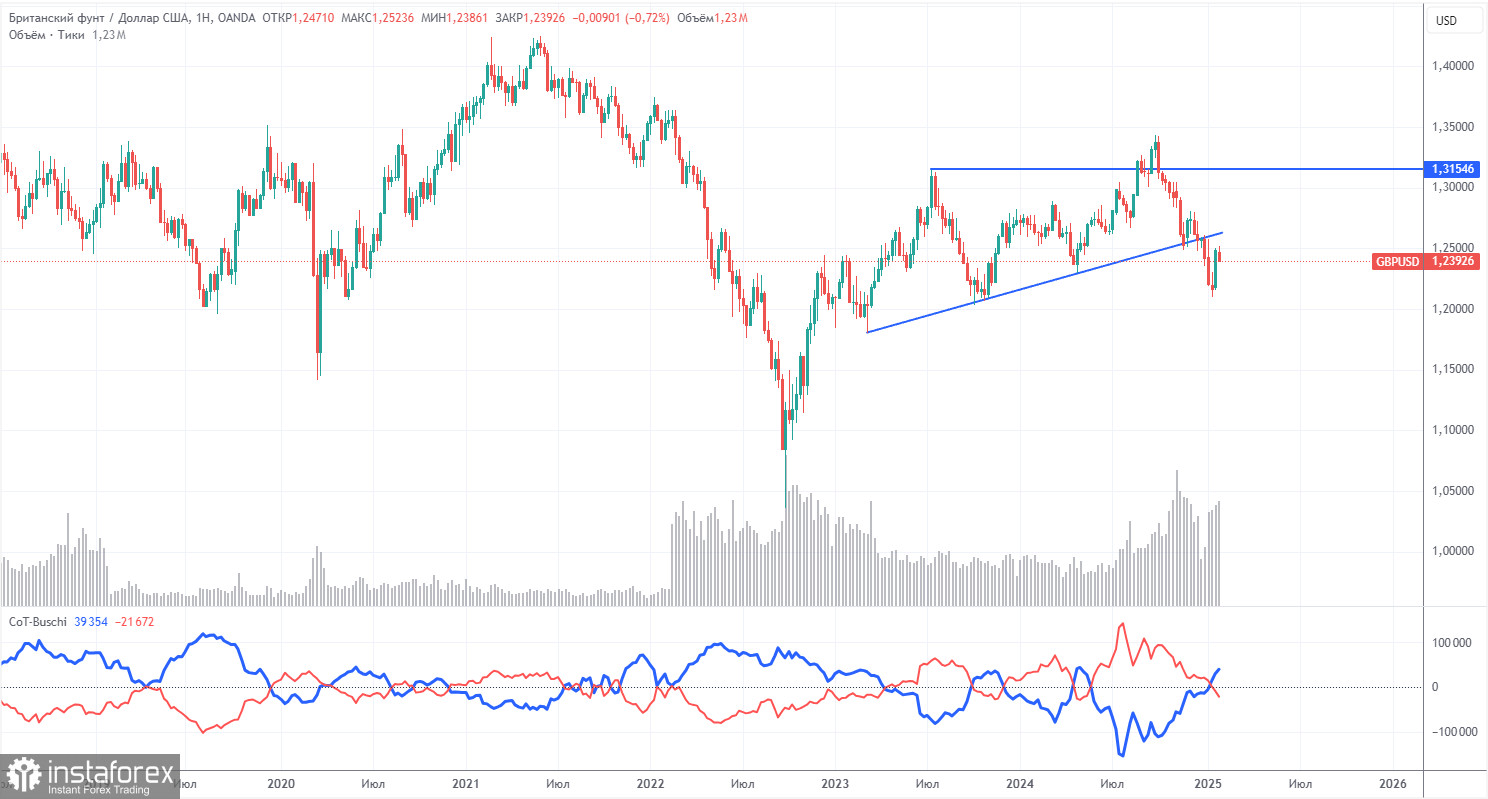
COT reports on the British pound indicate that the sentiment among commercial traders has been consistently shifting in recent years. The red and blue lines, which represent the net positions of commercial and non-commercial traders, often intersect and remain close to the zero mark. Currently, these lines are near each other, suggesting an approximately equal number of long and short positions.
On the weekly timeframe, the price initially broke through the 1.3154 level before dropping to the trendline, which it subsequently breached. This break suggests that the decline of the pound is likely to continue. However, it's important to note the rebound from the penultimate local low seen on the weekly timeframe, indicating that we might be experiencing a flat market.
The most recent report on the British pound shows that the non-commercial group closed 16,400 buy contracts and 2,900 sell contracts. As a result, the net position of non-commercial traders decreased by another 13,500 contracts over the week, which does not bode well for the pound.
The fundamental backdrop continues to lack support for long-term purchases of the British pound, with the currency facing a real possibility of continuing its global downtrend. Hence, the net position may continue to decline, indicating a further decrease in demand for the pound.
GBP/USD 1-Hour Analysis
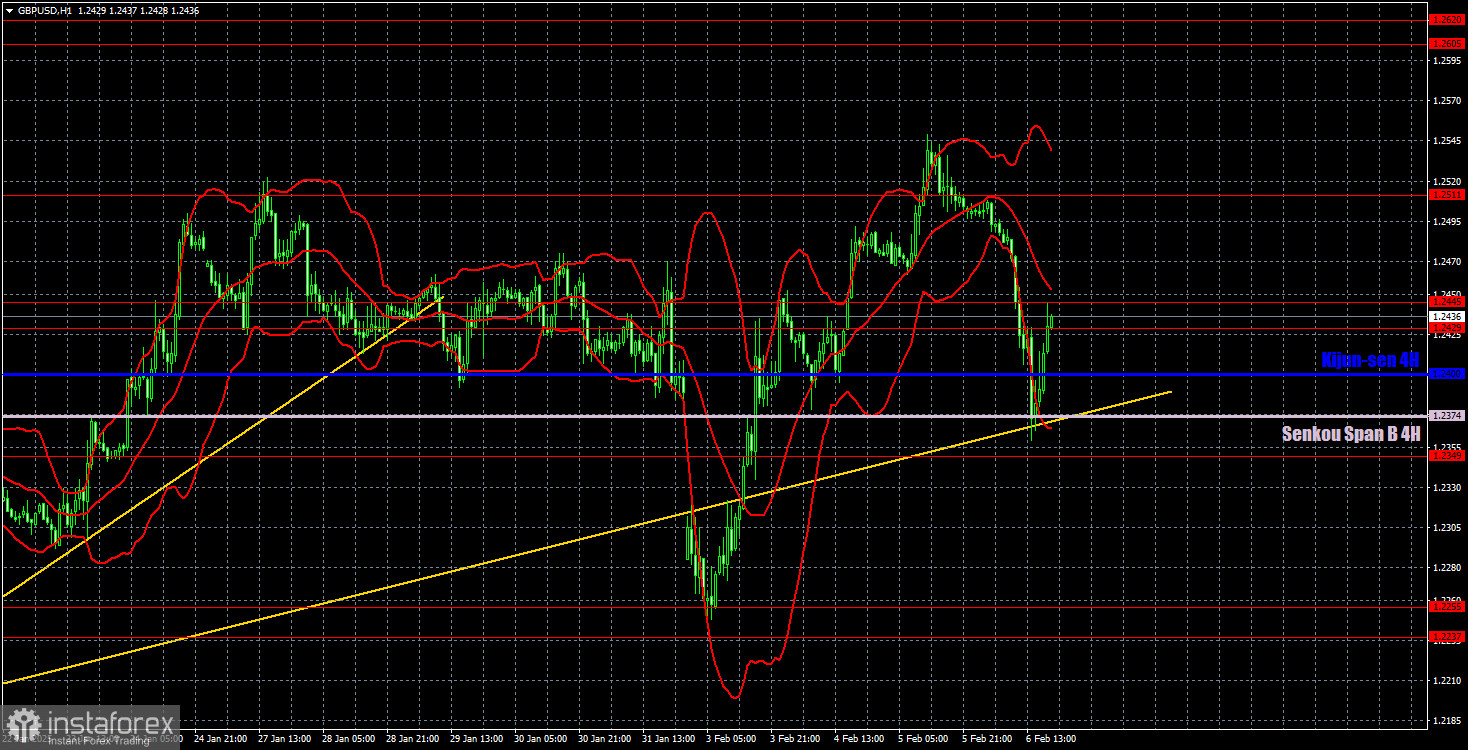
On the hourly timeframe, GBP/USD is currently exhibiting a local uptrend, even though it has broken the trendline. There are no fundamental reasons to expect the pound to appreciate in the long term. However, given the short-term bullish trend, traders should consider taking long positions on lower timeframes. From a higher timeframe and long-term perspective, we do not recommend purchasing the pound, as its fundamental outlook remains weak.
For February 7, the following key levels are identified: 1.2052, 1.2109, 1.2237-1.2255, 1.2349, 1.2429-1.2445, 1.2511, 1.2605-1.2620, 1.2691-1.2701, and 1.2796-1.2816. The Senko Span B level at 1.2374 and the Kijun-sen at 1.2400 may also serve as significant trading signals. It is advisable to set a Stop Loss at breakeven once the price moves 20 pips in the favorable direction. Keep in mind that the Ichimoku indicator lines may shift throughout the day, so they should be factored into trade signal decisions.
On Friday, there are no major events scheduled in the UK, which means all attention will be on U.S. macroeconomic data. These reports could potentially create volatility in the currency market. Technically, the hourly chart indicates further upward movement; therefore, if the U.S. data comes out weak or mixed, the pound may continue to rise.
Illustration Explanations:
- Support and Resistance Levels (thick red lines): Thick red lines indicate where movement may come to an end. Please note that these lines are not sources of trading signals.
- Kijun-sen and Senkou Span B Lines: Ichimoku indicator lines transferred from the 4-hour timeframe to the hourly timeframe. These are strong lines.
- Extreme Levels (thin red lines): Thin red lines where the price has previously bounced. These serve as sources of trading signals.
- Yellow Lines: Trendlines, trend channels, or any other technical patterns.
- Indicator 1 on COT Charts: Represents the net position size for each category of traders.