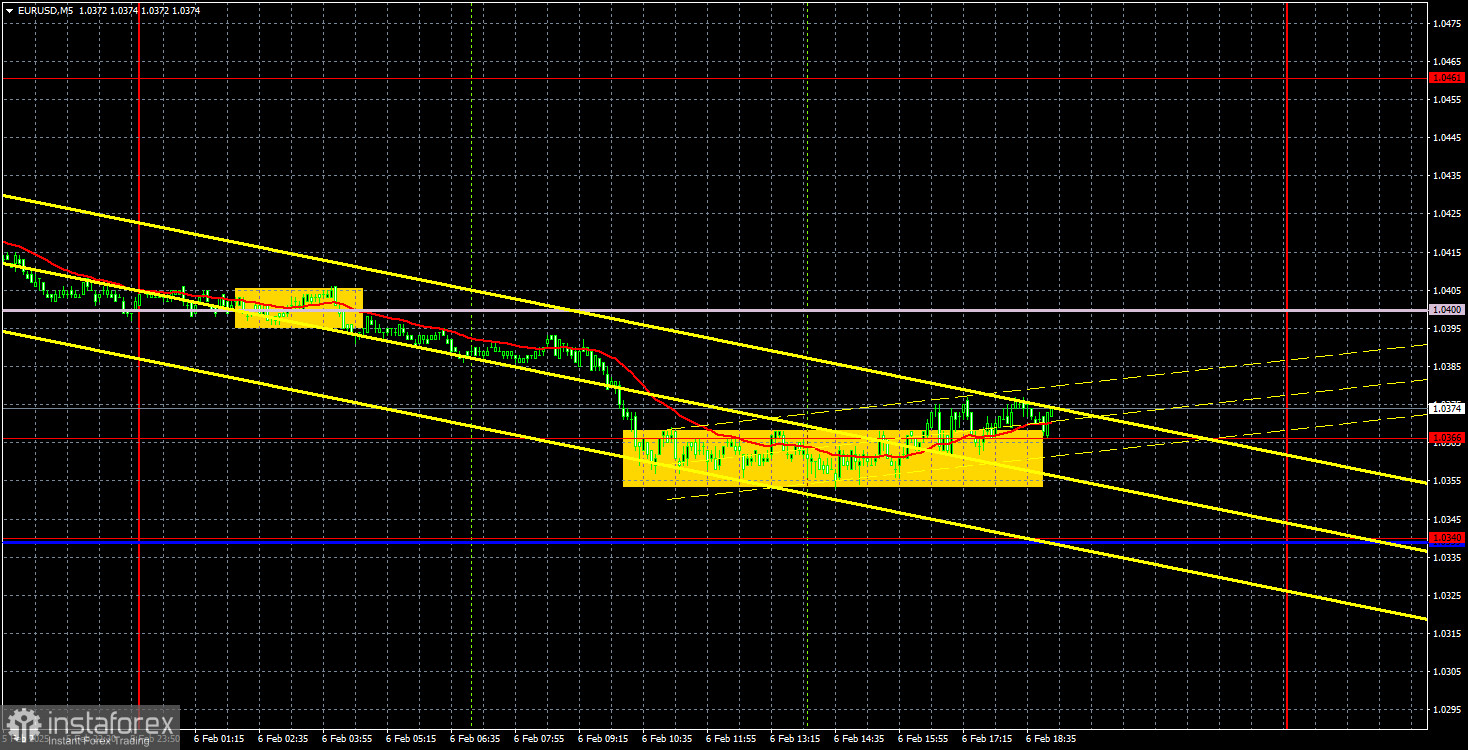
EUR/USD 5-Minute Analysis
The EUR/USD currency pair experienced a slight pullback on Thursday after three consecutive days of gains. There were few macroeconomic events on that day, and the market largely ignored the results of the Bank of England's meeting. Consequently, the European currency remained largely unaffected. However, a weak retail sales report did have an impact. While the report can't be classified as outright disastrous, its actual figures once again fell short of expectations. As a result, the euro's decline during the European trading session was fully justified this time.
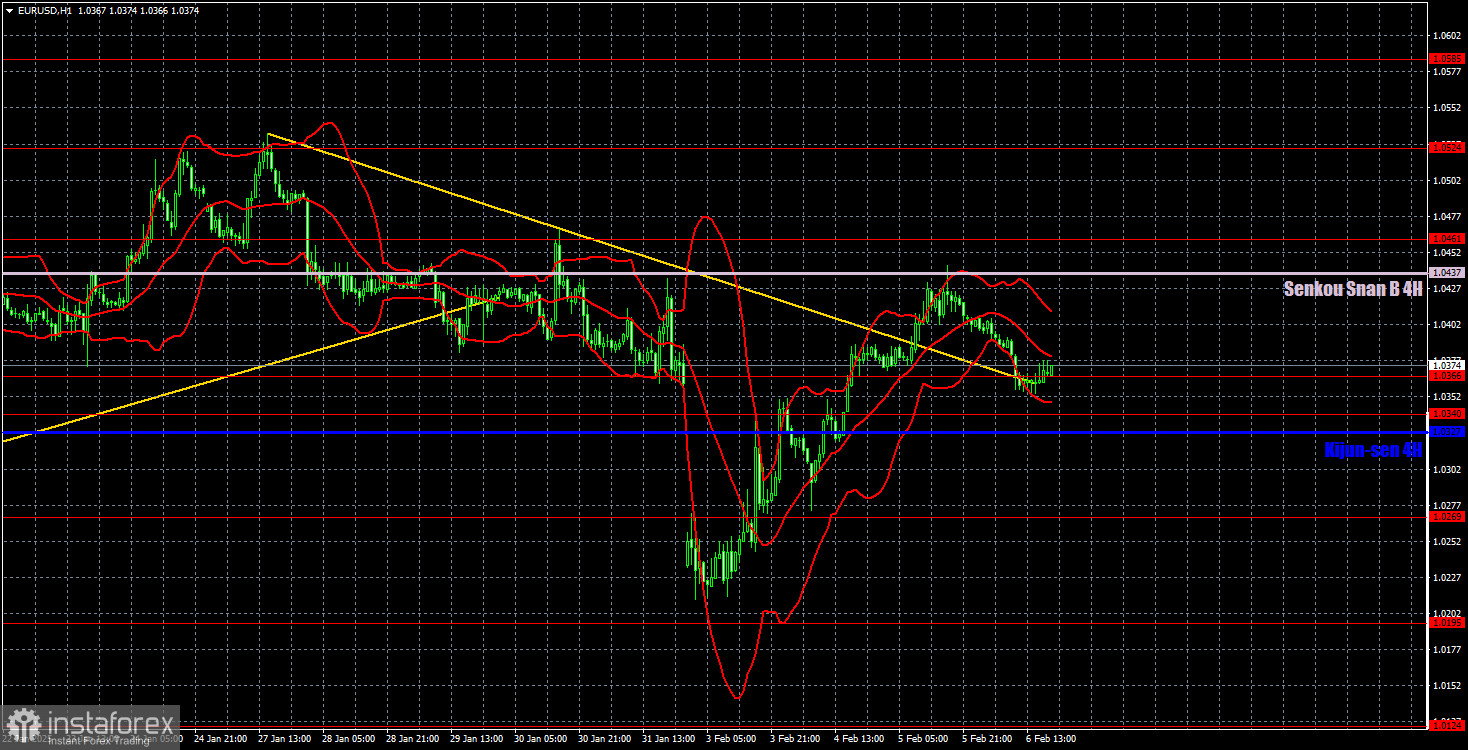
Looking ahead to an important Friday, let's highlight the technical picture on the hourly chart. First, it's important to remember that an upward correction is still ongoing on the daily timeframe. We noted that this correction could manifest on the hourly timeframe as a series of alternating trends, and that is precisely what is happening. Secondly, the price broke through a descending trend line but then pulled back down, suggesting a false breakout. However, we believe that the breakout is genuine. A new euro rally could commence from the 1.0340–1.0366 zone or the critical line. Of course, today's Non-Farm Payrolls report and the U.S. unemployment rate could disrupt this scenario. If the data supports the dollar, we may see this expected movement on Friday.
On the 5-minute timeframe, only two signals were generated yesterday, and volatility remained low. Overnight, the price breached the Senkou Span B line, but by the time the European session opened, traders could still enter sell orders. The price then fell to 1.0366, where all movement for the day stalled. Technically, there was a rebound from this level, but as mentioned, price action on Thursday was largely muted.
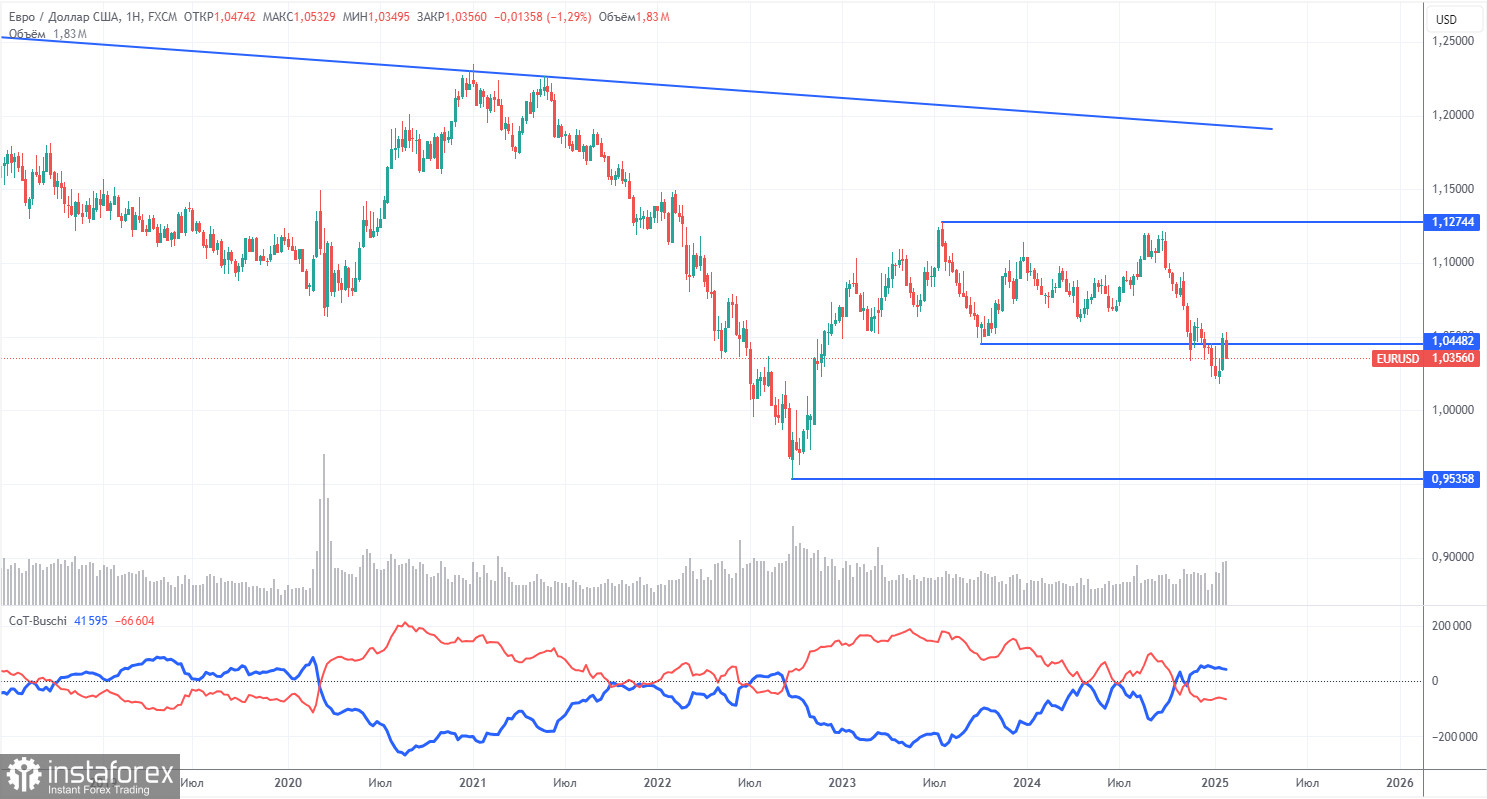
COT Report
The latest COT report is dated January 28. The chart clearly shows that the net position of non-commercial traders remained bullish for an extended period; however, bears have now gained the upper hand. Two months ago, professional traders sharply increased the number of short positions, causing the net position to turn negative for the first time in a long time. This shift indicates that the euro is being sold more frequently than it is being bought.
Currently, there are no fundamental factors supporting the euro's strength. The recent upward movement of the euro on the weekly timeframe is barely noticeable and can be seen as just a simple pullback. While the pair may correct for a few more weeks, this does not change the 16-year downtrend.
At present, the red and blue lines have crossed and changed their relative positions, indicating a bearish trend in the market. Over the last reporting week, the number of long positions in the non-commercial group decreased by 14,000, while short positions fell by 9,900. As a result, the net position decreased by another 4,100 contracts.
EUR/USD 1-Hour Analysis
On the hourly timeframe, the currency pair has ended its local downtrend, breaking the descending trend line. We believe that the decline will persist in the medium term, as the Federal Reserve is expected to cut rates only 1-2 times in 2025. This outlook is much more hawkish than what the market previously anticipated. However, in the short term, we may see one or two upward trends. There are currently no strong reasons for the euro to increase, but the ongoing correction is affecting its performance.
For February 7, the key trading levels are: 1.0124, 1.0195, 1.0269, 1.0340-1.0366, 1.0461, 1.0524, 1.0585, 1.0658-1.0669, 1.0757, 1.0797, and 1.0843. Additionally, the Ichimoku indicator lines include Senkou Span B at 1.0437 and Kijun-sen at 1.0327. The Ichimoku indicator lines may shift throughout the day, so they should be monitored carefully when determining trading signals. Stop-loss orders should be set to breakeven if the price moves 15 pips in the correct direction to protect against potential losses in case of a false signal.
On Friday, the European Union will release only a minor report on German industrial production. In contrast, the United States will unveil several important data, including Nonfarm Payrolls, unemployment rates, wages, and the consumer sentiment index. As a result, significant market movements are anticipated in the afternoon, and these shifts could vary widely. The actual values of the reports mentioned are uncertain and cannot be predicted in advance.
Illustration Explanations:
- Support and Resistance Levels (thick red lines): Thick red lines indicate where movement may come to an end. Please note that these lines are not sources of trading signals.
- Kijun-sen and Senkou Span B Lines: Ichimoku indicator lines transferred from the 4-hour timeframe to the hourly timeframe. These are strong lines.
- Extreme Levels (thin red lines): Thin red lines where the price has previously bounced. These serve as sources of trading signals.
- Yellow Lines: Trendlines, trend channels, or any other technical patterns.
- Indicator 1 on COT Charts: Represents the net position size for each category of traders.