The EUR/USD currency pair finally began to decline on Thursday, but once again, this movement was not linked to macroeconomic factors or fundamental events. It wasn't even related to Donald Trump. On Thursday morning, Germany released an industrial production report that exceeded forecasts. This should have given the euro a legitimate reason to rise, at least in the morning. Moreover, the U.S. inflation report was published on Wednesday, which theoretically could have triggered a drop in the dollar (and thus a rise in EUR/USD). However, the euro failed to show any growth on either Wednesday or Thursday, once again proving that the market is ignoring all news unrelated to Trump's tariffs. As a result, we've seen a strong euro rally for a week and a half, but the market now seems unable to continue. Either a correction is needed, or this upward movement will end.
We fully support the idea of ending this irrational growth of the euro. The U.S. economy has not yet begun to shrink, Trump has not yet imposed new sanctions, and the Federal Reserve isn't considering more than two rate cuts in 2025. Yet, the market has already priced in the worst-case scenario for the dollar. Maybe it's right, or maybe not. From a technical standpoint, the six-month and 16-year downtrends are still relevant, though this latest surge in growth is quite unsettling. However, if the decline resumes now, the pair still has a chance to return to the 1.0200 level and possibly even reach price parity.
Two weeks ago, who could have predicted that the euro would surge from 1.0370 to 1.0940 in just a few days? No one expected it, but it happened. So, if the pair drops by 300-400 pips, that wouldn't be surprising. Once again, the dollar is not weak enough to lose 600 pips in just two weeks.
Meanwhile, the European Union is imposing retaliatory tariffs on U.S. imports. It is unclear which goods will be affected, but the tariffs will likely be proportional to the ones imposed on aluminum and steel. Donald Trump has already stated that any retaliatory measures are "unacceptable" and that Washington will consider imposing additional tariffs—specifically on the European automotive industry. In other words, the EU is following in Canada's footsteps: Canada refused to become America's "51st state" and responded to Trump's tariffs with its own. As a result, Trump further increased tariffs on Canadian goods. However, as we can see, these developments no longer trigger a decline in the dollar.
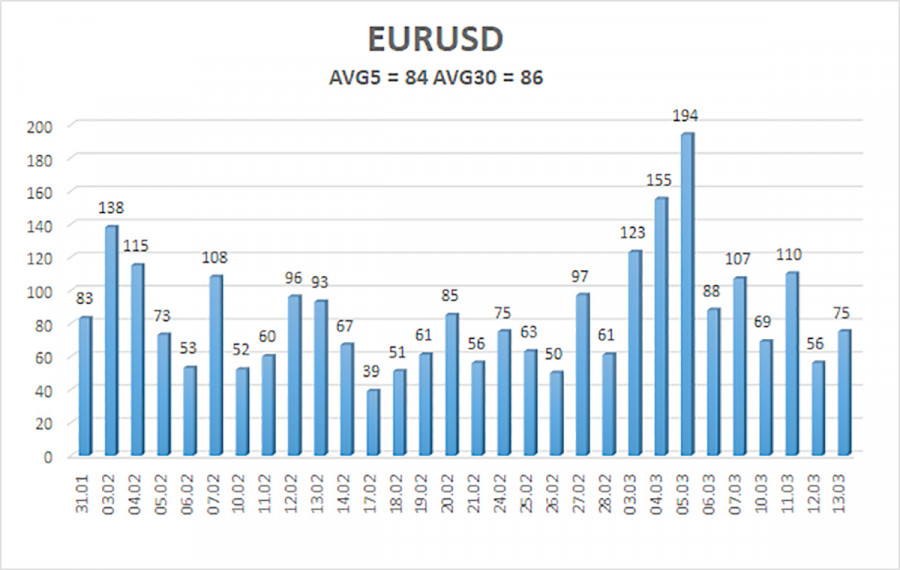
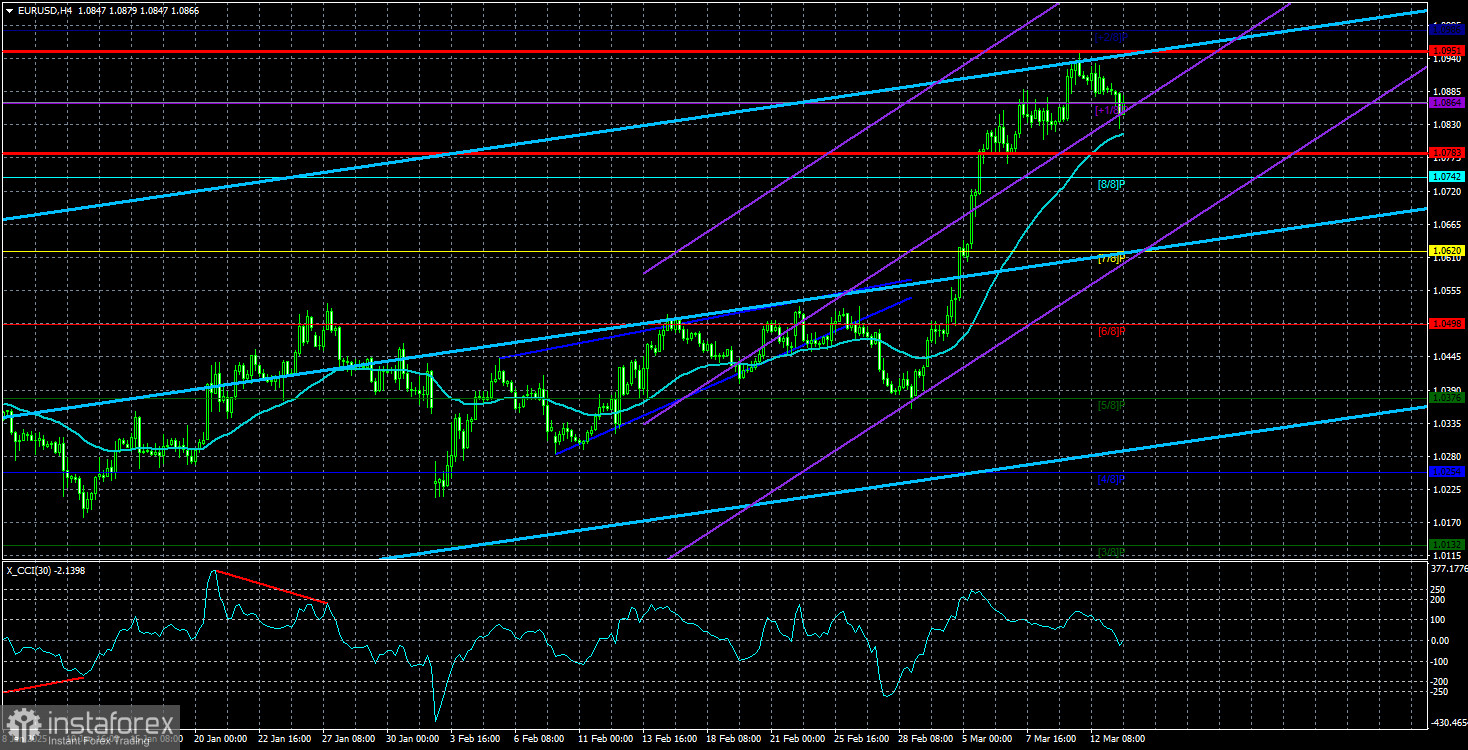
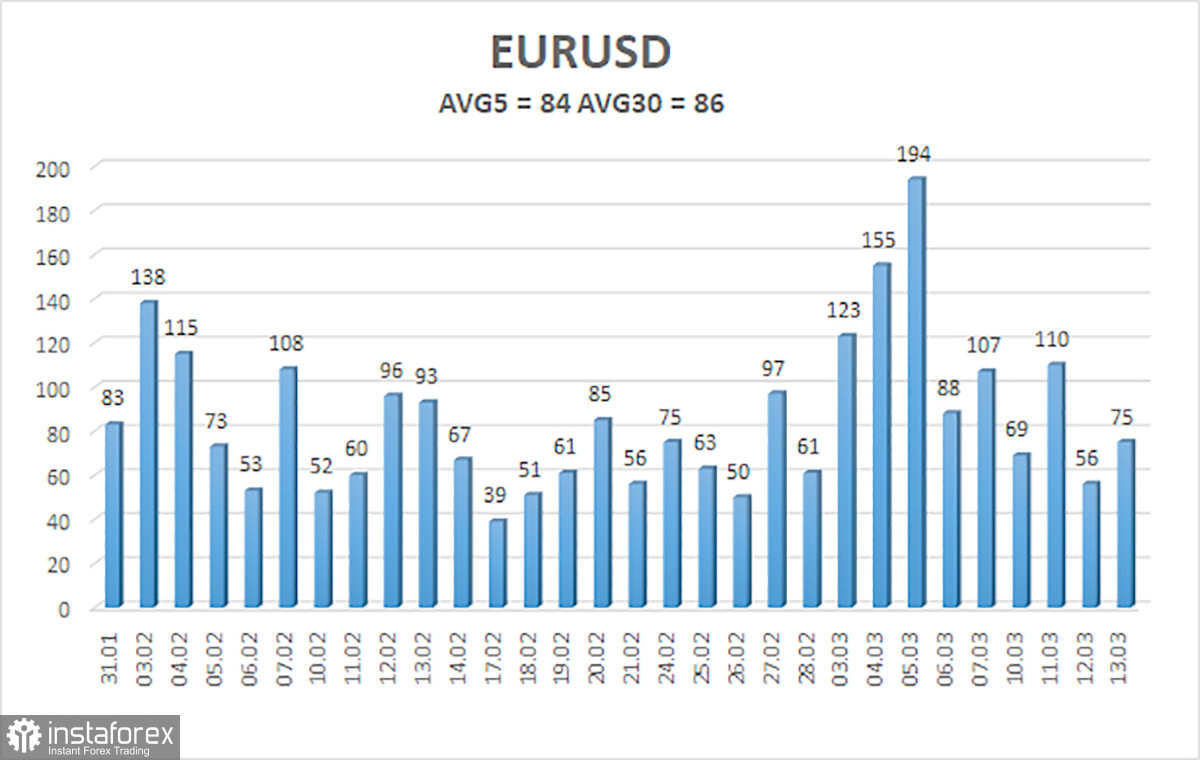
The average volatility of the EUR/USD currency pair over the last five trading days, as of March 14, is 84 pips and is considered "moderate." We expect the pair to move between the levels of 1.0783 and 1.0951 on Friday. The long-term regression channel has turned upward, but the global downtrend remains intact, as seen on higher time frames. The CCI indicator dipped into oversold territory again, signaling another wave of upward correction, which now barely looks like a correction at all...
Nearest Support Levels:
S1 – 1.0864
S2 – 1.0742
S3 – 1.0620
Nearest Resistance Levels:
R1 – 1.0986
Trading Recommendations:
The EUR/USD pair has exited its sideways channel and continues rising rapidly. In recent months, we have consistently stated that we expect the euro to decline in the medium term, and nothing has changed. The dollar still has no objective reasons for a medium-term decline—except for Donald Trump. Short positions remain far more attractive, with targets at 1.0315 and 1.0254, but at this point, it's extremely difficult to predict when the rally will end. If you trade based purely on technical analysis, long positions can be considered as long as the price remains above the moving average, with targets at 1.0951 and 1.0986.
Explanation of Illustrations:
Linear Regression Channels help determine the current trend. If both channels are aligned, it indicates a strong trend.
Moving Average Line (settings: 20,0, smoothed) defines the short-term trend and guides the trading direction.
Murray Levels act as target levels for movements and corrections.
Volatility Levels (red lines) represent the likely price range for the pair over the next 24 hours based on current volatility readings.
CCI Indicator: If it enters the oversold region (below -250) or overbought region (above +250), it signals an impending trend reversal in the opposite direction.