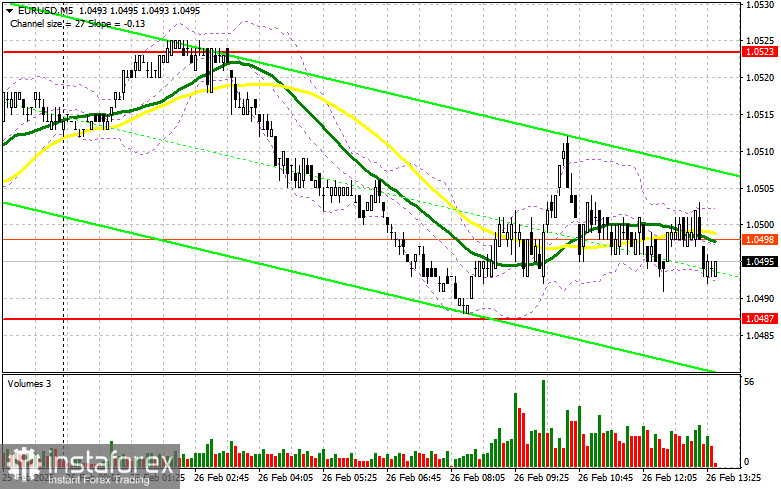
In my morning forecast, I focused on the 1.0487 level as a key point for market entry decisions. Let's examine the 5-minute chart to understand what happened. The price declined, but no suitable entry points formed, leaving me without trades due to the 25-point volatility. The technical outlook for the second half of the day remains unchanged.
Opening Long Positions on EUR/USD:
The lack of significant data from the Eurozone has kept the euro within a narrow sideways channel. Given that Germany's leading indicators disappointed, an active upward movement was unlikely even after a decent Asian session correction.
Later today, the market will focus on U.S. new home sales data and FOMC member speeches. A dovish tone from policymakers could provide a reason to buy the euro. However, if strong U.S. housing market data exerts pressure on the euro, I will rely on the 1.0487 support level. Only after a false breakout at this level would I consider a long entry, aiming for a rise toward 1.0523, the upper boundary of the range.
A break and retest of this range from above would confirm a strong buy signal, potentially leading to 1.0564, with the final target at 1.0593, where I plan to lock in profits.
If EUR/USD declines without buying interest around 1.0487, which is more likely, buyers will lose control, allowing sellers to push the price toward 1.0456, the lower boundary of the range. A false breakout at 1.0456 would be another entry point for buying the euro. I plan to buy immediately on a rebound from 1.0430, targeting an intraday correction of 30-35 points.
Opening Short Positions on EUR/USD:
Despite the absence of significant data, sellers attempted to act, but their efforts were insufficient to regain bearish control.
If EUR/USD rises in the second half of the day, the focus will be on defending the 1.0523 resistance level. Losing this level would signal the return of bullish sentiment. To confirm their presence, sellers need to trigger a false breakout at 1.0523, allowing short entries targeting a decline toward 1.0487— the midpoint of the range, where moving averages favor buyers.
A break and consolidation below 1.0487, followed by a retest from below, would confirm another selling opportunity, driving EUR/USD toward 1.0456. The final target for sellers is 1.0430, where I plan to take profits.
If EUR/USD rises further in the U.S. session and sellers fail to defend 1.0523, buyers could gain momentum. In this case, I will delay short positions until testing the next resistance at 1.0564, where I will sell only after an unsuccessful breakout. I plan to short immediately on a bounce from 1.0593, aiming for a 30-35 point downward correction.
Commitment of Traders (COT) Report:
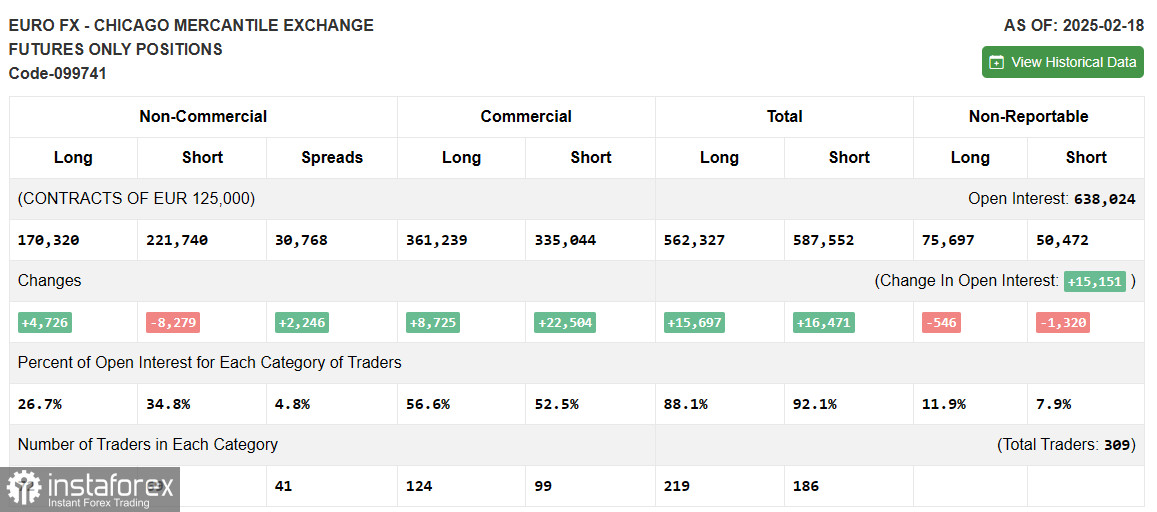
The COT report for February 18 showed a rise in long positions and a sharp decline in short positions. Buying interest in the euro increased, driven by Russia-U.S. negotiations on the Ukraine conflict. The growing likelihood of a ceasefire in the coming months has boosted demand for risk assets, supporting the euro's recovery.
However, sellers still hold the advantage, so caution is advised when buying at highs. The COT report indicates that non-commercial long positions increased by 4,726 to 170,320. Non-commercial short positions fell by 8,279 to 221,740. The gap between long and short positions narrowed by 2,246.
Indicator Signals:
Moving Averages:
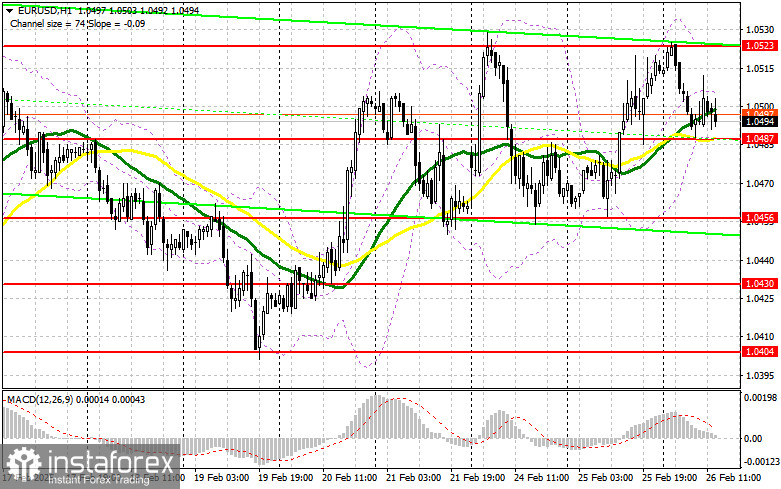
EUR/USD is trading around the 30 and 50-day moving averages, signaling market uncertainty.
Note: The author's moving average settings are based on the H1 chart, which differs from the classic daily moving averages (D1).
Bollinger Bands:
If the pair declines, the lower Bollinger Band at 1.0487 will act as support.
Indicator Descriptions:
- Moving Average (MA): Identifies the current trend by smoothing price volatility (50-period in yellow, 30-period in green).
- MACD Indicator: Measures moving average convergence/divergence (Fast EMA – 12, Slow EMA – 26, Signal SMA – 9).
- Bollinger Bands: Measures volatility and identifies support/resistance levels (20-period).
- Non-commercial traders: Speculative players (retail traders, hedge funds, and institutions) using futures markets for speculation.
- Non-commercial long positions: The total long open interest held by speculative traders.
- Non-commercial short positions: The total short open interest held by speculative traders.
- Net non-commercial position: The difference between long and short speculative positions.