Analysis of Tuesday's Trades
1H Chart of GBP/USD
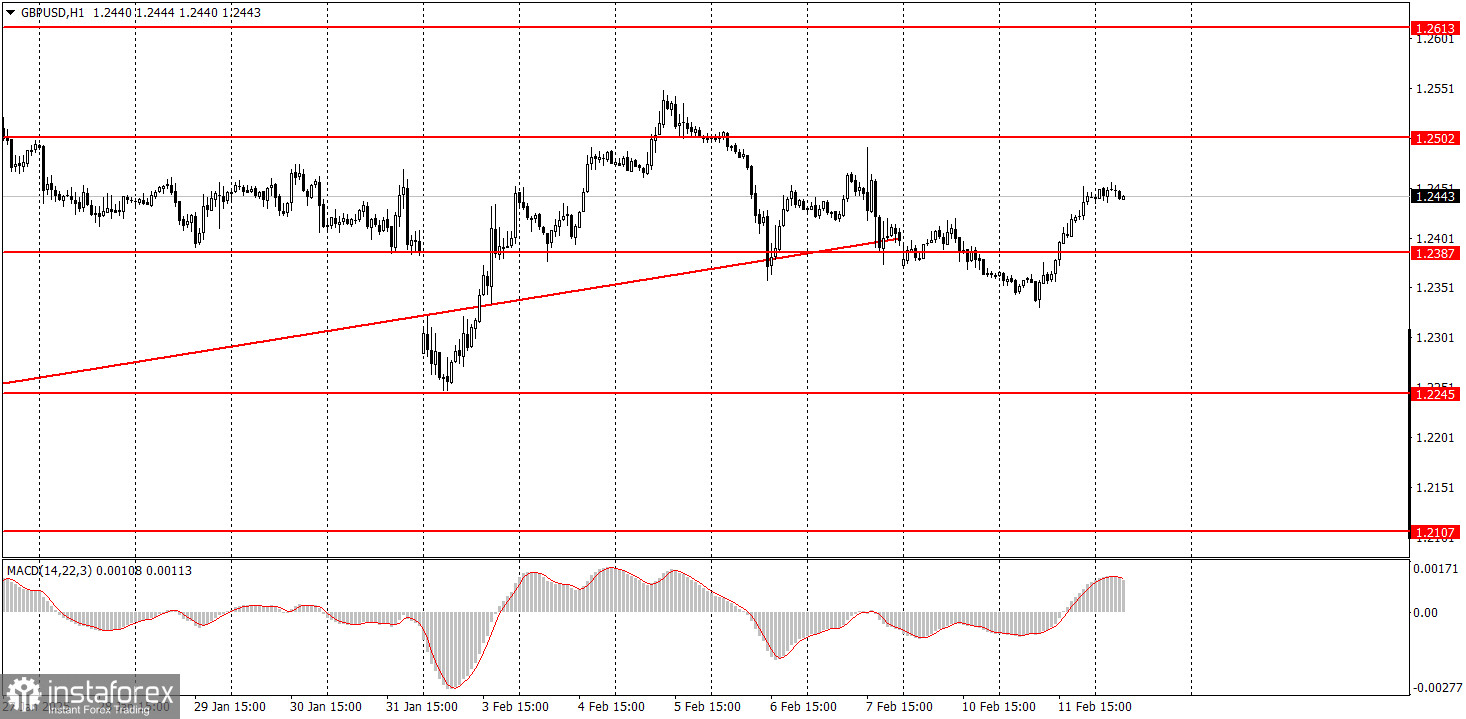
The GBP/USD pair also traded higher on Tuesday, although there was no clear reason for it. However, who really looks for reasons in a flat market? Even on the hourly time frame, it's evident that the price has been predominantly moving sideways recently. While there is some indication of an upward correction on the daily time frame, the hourly chart shows a pattern of constantly alternating trends. Overall, the price movements of recent weeks can be categorized as a correction, which often comes with a fair amount of confusion within corrections. For a while, we saw relatively clear trends on the hourly chart, but now we are facing outright confusion.
In addition to Jerome Powell's speech yesterday, there was also a statement from Bank of England Governor Andrew Bailey. However, Bailey provided no significant insights for the market. He discussed the relationship between financial stability and economic growth but did not address monetary policy. As a result, the recent appreciation of the pound and euro lacks a solid fundamental or macroeconomic basis.
5M Chart of GBP/USD
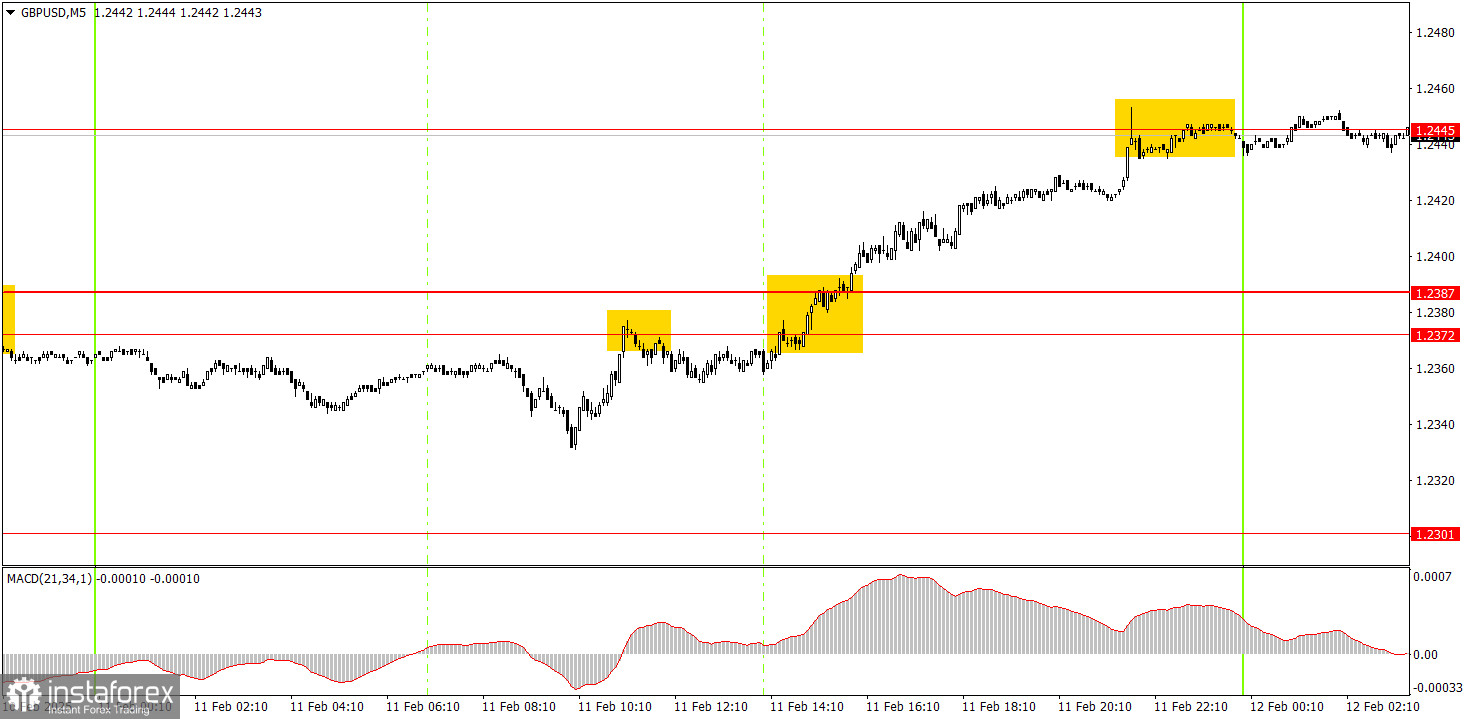
On the 5-minute timeframe, two trading signals were generated on Tuesday. First, the currency pair rebounded from the 1.2372–1.2387 zone before breaking above it. The first signal turned out to be false, as the price failed to move even 20 pips in the anticipated direction, making it impossible to set a Stop Loss at breakeven. However, the second signal was much stronger, allowing traders to offset the losses from the first trade.
Trading Strategy for Wednesday:
On the hourly timeframe, GBP/USD may begin a short-term downtrend, but the overall movement over the past few weeks appears to be a correction on the daily chart. In the medium term, we maintain a bearish outlook for the pound, targeting 1.1800, which we believe is the most logical scenario. Traders should wait for the daily timeframe correction to conclude before considering new positions.
On Wednesday, GBP/USD could enter a new bearish cycle, as the market remains highly volatile. Yesterday, the pound rose without any clear reason, and it could just as easily fall today.
For the 5-minute timeframe, the key trading levels are: 1.2010, 1.2052, 1.2089–1.2107, 1.2164–1.2170, 1.2241–1.2270, 1.2301, 1.2372–1.2387, 1.2445, 1.2502–1.2508, 1.2547, 1.2633, 1.2680–1.2685, 1.2723, and 1.2791–1.2798. On Wednesday, there are no major events scheduled in the UK. In the U.S., Jerome Powell will deliver his second congressional testimony, and the January inflation report (CPI) will be released. We recommend focusing on the CPI data.
Core Trading System Rules:
- Signal Strength: The shorter the time it takes for a signal to form (a rebound or breakout), the stronger the signal.
- False Signals: If two or more trades near a level result in false signals, subsequent signals from that level should be ignored.
- Flat Markets: In flat conditions, pairs may generate many false signals or none at all. It's better to stop trading at the first signs of a flat market.
- Trading Hours: Open trades between the start of the European session and the middle of the US session, then manually close all trades.
- MACD Signals: On the hourly timeframe, trade MACD signals only during periods of good volatility and a clear trend confirmed by trendlines or trend channels.
- Close Levels: If two levels are too close (5–20 pips apart), treat them as a support or resistance zone.
- Stop Loss: Set a Stop Loss to breakeven after the price moves 20 pips in the desired direction.
Key Chart Elements:
Support and Resistance Levels: These are target levels for opening or closing positions and can also serve as points for placing Take Profit orders.
Red Lines: Channels or trendlines indicating the current trend and the preferred direction for trading.
MACD Indicator (14,22,3): A histogram and signal line used as a supplementary source of trading signals.
Important Events and Reports: Found in the economic calendar, these can heavily influence price movements. Exercise caution or exit the market during their release to avoid sharp reversals.
Forex trading beginners should remember that not every trade will be profitable. Developing a clear strategy and practicing proper money management are essential for long-term trading success.