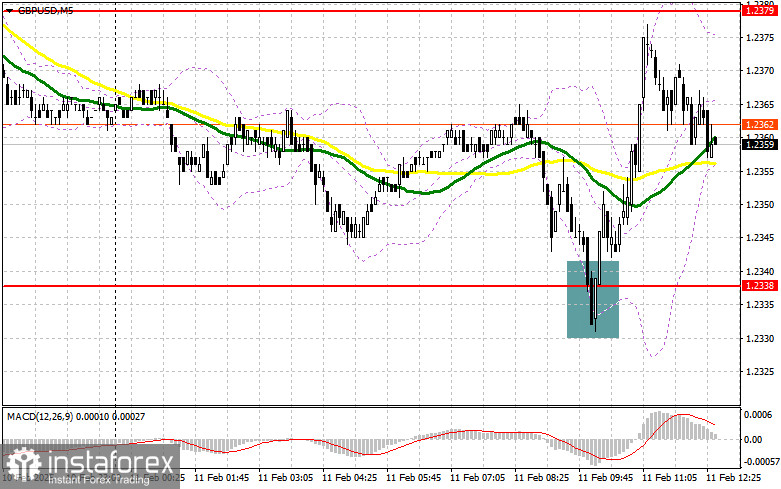
In my morning forecast, I highlighted the 1.2338 level as a key point for market entry decisions. Looking at the 5-minute chart, the initial decline and a false breakout at 1.2338 provided a strong buying opportunity, resulting in a 40+ point rally. The technical outlook was revised for the second half of the day.
To open long positions in GBP/USD, you need:
Pound buyers reacted to Bank of England statements, quickly pushing GBP/USD higher from 1.2338. However, a larger bullish correction did not materialize, indicating that the uptrend lacks momentum.
The next market move will depend on statements from Fed officials. Jerome Powell's testimony could provide new insights into the Fed's future policy stance. Given the strong U.S. labor market data, Powell is likely to maintain a cautious stance, which could strengthen the U.S. dollar against the pound.
If GBP/USD declines, I will only consider long positions after a false breakout at 1.2338, which performed well earlier today. I will open long positions based on growth in the level of 1.2379, which was a couple of points short of the test today. A breakout with a top-down reverse test of this range will lead to a new entry point into long positions with the prospect of updating 1.2418, which will return the pound to bullish prospects. The furthest target will be the level of 1.2462, where I'm going to take profits.
If GBP/USD drops below 1.2338 without buyer interest, selling pressure will increase. In this case, a false breakout at 1.2294 would provide a new buying opportunity. Immediate buy orders will only be placed at 1.2248, targeting a 30-35 point intraday correction.
To open short positions in GBP/USD, you need:
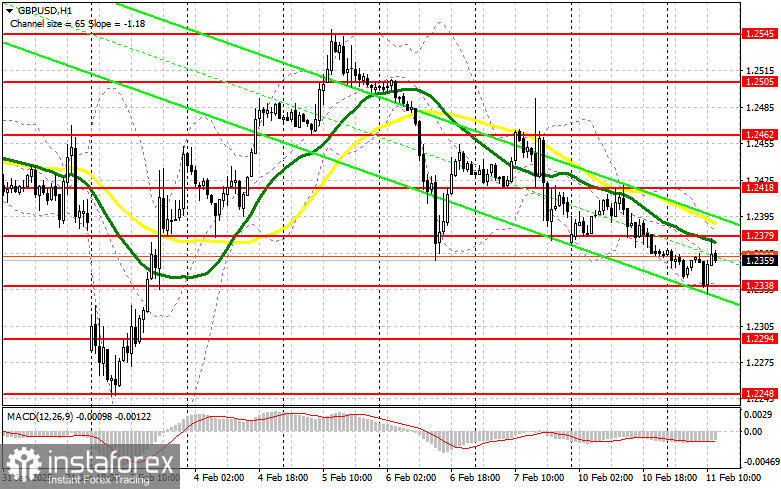
Sellers attempted to push GBP/USD lower, but their efforts were limited due to support from BoE officials advocating economic stimulus. If GBP/USD rises following Powell's speech, selling pressure will likely emerge at 1.2379, where the 30 and 50-period moving averages align with resistance. A false breakout at 1.2379 would provide a strong short entry, targeting 1.2338.
A breakout and retest below 1.2338 could trigger stop-loss hunting, driving GBP/USD lower toward 1.2294. The furthest target will be the 1.2248 level, where I will take profits. If demand for GBP remains strong in the U.S. session, and sellers fail to defend 1.2379, GBP/USD may stall within a range. In this case, I will delay selling until a test of 1.2418. Short positions will only be entered after a failed breakout at 1.2418. If GBP/USD fails to decline after reaching 1.2418, I will look for a short entry at 1.2462, targeting a 30-35 point correction.
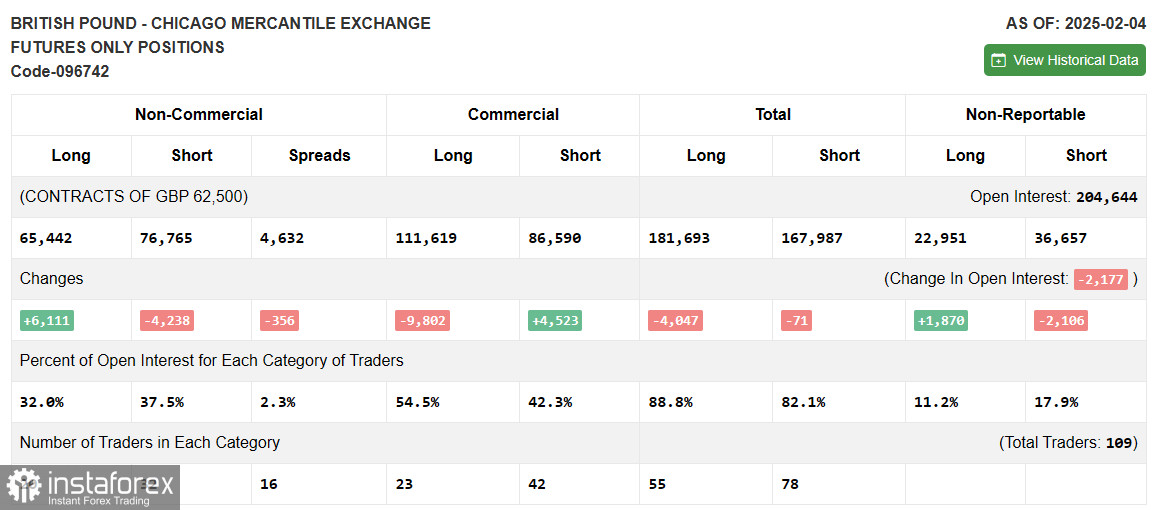
The COT report (Commitment of Traders) for February 4 showed a reduction in short positions and an increase in long positions. However, traders should not rush into buying GBP just yet. The report does not account for the BoE's rate cut or its more dovish stance. Recent GBP strength was only a correction, while broader selling pressure remains. New U.S. tariffs and White House policy decisions will weigh on risk assets and support USD demand.
The latest COT report indicated that Non-commercial long positions increased by 6,111 to 65,442. Non-commercial short positions decreased by 4,238 to 76,765. The gap between long and short positions narrowed by 356.
Technical Indicator Signals
Moving Averages
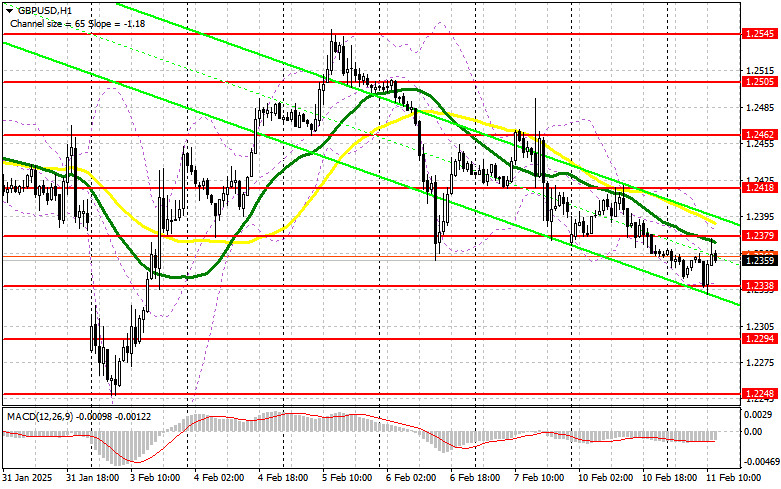
GBP/USD is trading below the 30 and 50-period moving averages, signaling continued downside potential.
Note: The moving averages are based on the hourly (H1) timeframe, which differs from traditional daily (D1) moving averages.
Bollinger Bands:
Lower Bollinger Band at 1.2338 serves as intraday support.
Indicator Descriptions:
- Moving Average (MA 50) – Identifies trend direction and smooths price volatility (Yellow line).
- Moving Average (MA 30) – Identifies trend direction and smooths price volatility (Green line).
- MACD Indicator:
- Fast EMA (12-period)
- Slow EMA (26-period)
- Signal SMA (9-period)
- Bollinger Bands (20-period): Measures volatility and overbought/oversold conditions.
- Non-commercial traders:
- Hedge funds and institutions using futures for speculative trading.
- Long non-commercial positions: Total buy-side exposure of speculative traders.
- Short non-commercial positions: Total sell-side exposure of speculative traders.
- Net non-commercial position: The difference between long and short speculative positions.