empty
29.05.2024 06:37 AM
EUR/USD and GBP/USD: Technical analysis on May 29

EUR/USD

This image is no longer relevant

Higher timeframes

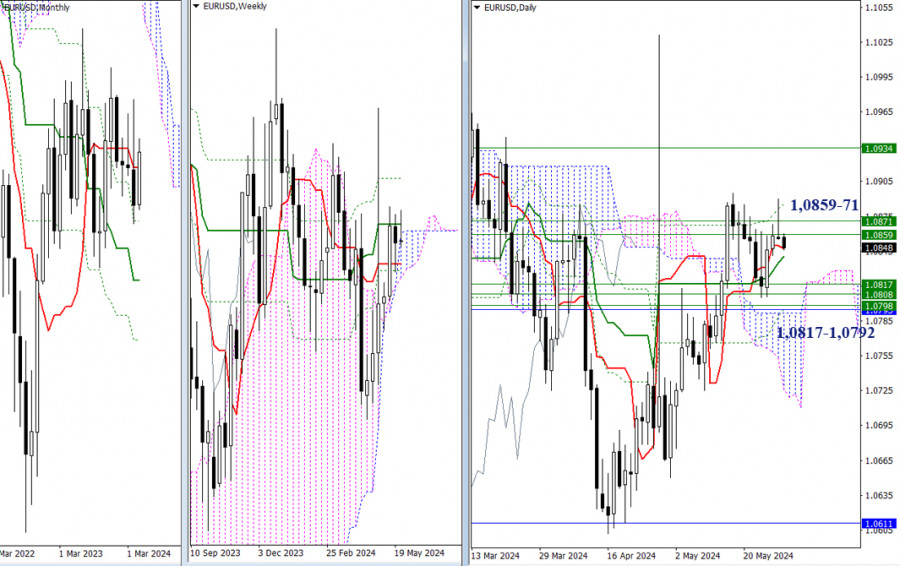
The bulls faced yet another setback. Yesterday, they failed to update the pair's high (1.0895) and move beyond the weekly resistances (1.0859 - 1.0871). As a result, EUR/USD bounced downwards. To confirm and work on this today, it is necessary to overcome the influence of the main levels of the daily cross at 1.0848 - 1.0840 (Tenkan + Kijun). After this, the next challenge will be interacting with a solid support area, which includes several strong levels from higher timeframes within a narrow range (1.0817 - 1.0792).

This image is no longer relevant

H4 – H1

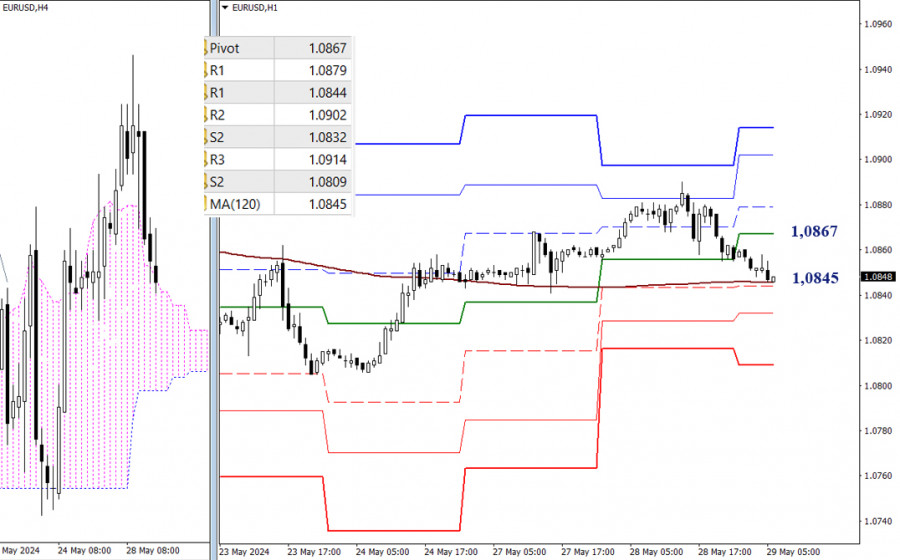
On the lower timeframes, the bearish correction has led to a test of the weekly long-term trend (1.0845). Breaking through this level could change the current balance of power. The next bearish targets after the intraday break will be the classic Pivot levels (1.0844 - 1.0832 - 1.0809). In case of a rebound from the weekly long-term trend, the focus will shift to recovering lost positions, and the market will concentrate on the resistance levels of the classic Pivot points. Currently, these resistances are located at 1.0867 - 1.0879 - 1.0902 - 1.0914.

***

GBP/USD

This image is no longer relevant

Higher Timeframes

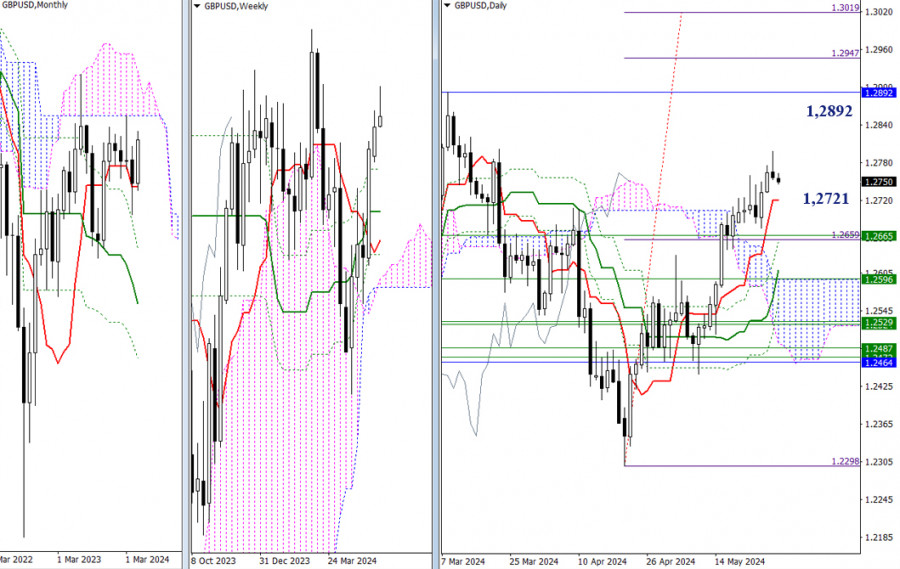
Yesterday, the bulls ended the day with the price gradually moving downwards. If it continues to decline, the market will encounter support levels at 1.2721 (daily short-term trend) and 1.2665 (weekly Fibo Kijun). However, if the bears fail to change the situation and the bulls overcome the slowdown, GBP/USD could rise, with bullish targets at 1.2892 (lower boundary of the monthly cloud) and 1.2947 – 1.3019 (daily target for breaking the cloud).

This image is no longer relevant

H4 – H1

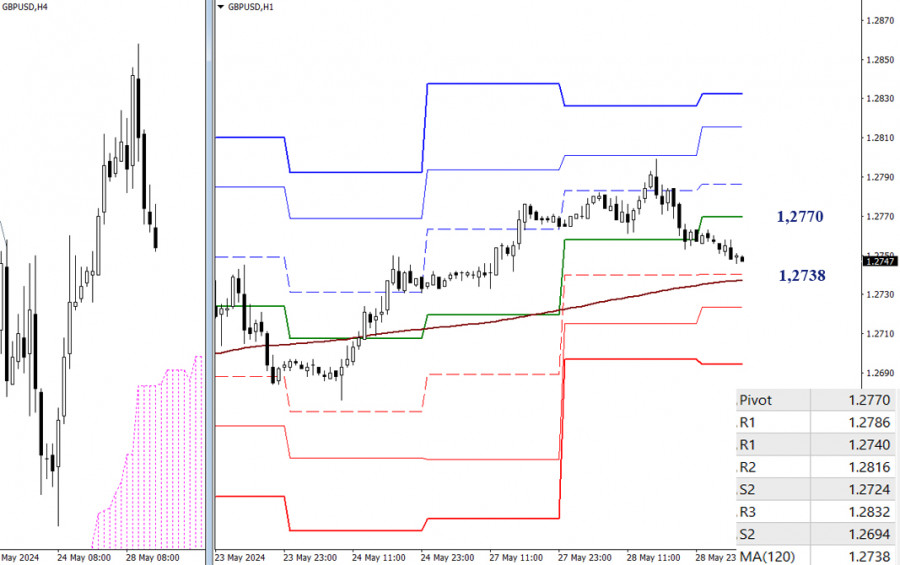
A correction is currently developing on the lower timeframes. The market is approaching a key level – the weekly long-term trend at 1.2738, which determines the current balance of power. Its outcome could set the course for further development. A rebound would shift the focus to the resistance levels of the classic Pivot points, which are located at 1.2770, 1.2786, 1.2816, and 1.2832. Conversely, a breakthrough would place the focus on the support levels of the classic Pivot points at 1.2724 and 1.2694.

***

The technical analysis of the situation uses:

Higher timeframes - Ichimoku Kinko Hyo (9.26.52) + Fibonacci Kijun levels

Lower timeframes - H1 - Pivot Points (classic) + Moving Average 120 (weekly long-term trend)

Evangelos Poulakis,
Especialista em análise na InstaForex
© 2007-2025
Selecionar intervalo de tempo
5
min
15
min
30
min
1
hora
4
horas
1
dia
1
s.
Ganhe com as variações das taxas das criptomoedas com a InstaForex.
Baixe o MetaTrader 4 e abra a sua primeira operação.
  • Grand Choice
    Contest by
    InstaForex
    InstaForex always strives to help you
    fulfill your biggest dreams.
    PARTICIPE DO CONCURSO

Recommended Stories

Sinais de negociação para EUR/USD para 5-8 de maio de 2025: venda abaixo de 1,1370 (EMA 200 - 6/8 de Murray)

A perspectiva geral permanece negativa para o euro, e há possibilidade de queda até o nível psicológico de 1,1000, que coincide com o nível 5/8 de Murray no curto prazo

Dimitrios Zappas 21:15 2025-05-05 UTC+2

Sinais de negociação para o OURO (XAU/USD) para 5-8 de maio de 2025: comprar acima de $3.305 (SMA 21 - 7/8 de Murray)

Por outro lado, uma fraqueza no metal abaixo da SMA 21 em 3.280 poderia retomar o ciclo de baixa. Portanto, podemos esperar que o ouro atinja a parte inferior

Dimitrios Zappas 21:06 2025-05-05 UTC+2

EUR/USD. Os resultados da reunião do Fed podem levar o par a uma queda

O par está se consolidando em uma faixa estreita abaixo do nível de resistência de 1,1345, em antecipação ao resultado da reunião de política monetária do Fed, que será concluída

Pati Gani 20:56 2025-05-05 UTC+2

Análise técnica do movimento intradiário do preço do ouro, segunda-feira, 05 de maio de 2025

Com o surgimento do padrão Cunha Descendente no gráfico de 4 horas, há indicação de que o ouro tem potencial para subir até o nível de 3.297,43 no curto prazo

Arief Makmur 17:56 2025-05-05 UTC+2

Análise técnica do movimento intradiário de preços do EUR/JPY, segunda-feira, 05 de maio de 2025

Ao analisar o gráfico de 4 horas do par EUR/JPY, observa-se um potencial de fortalecimento no curto prazo. Esse cenário é corroborado pela formação de um padrão de convergência entre

Arief Makmur 17:37 2025-05-05 UTC+2

GBP/USD – 5 de maio: Trump pode suspender as tarifas sobre a China

No gráfico horário, o par GBP/USD continuou sua queda na sexta-feira em direção ao nível de correção Fibonacci de 161,8%, em 1,3249. Uma recuperação a partir deste nível favorecerá

Samir Klishi 15:24 2025-05-05 UTC+2

EUR/USD – 5 de maio: O mercado de trabalho dos EUA não está sem esperanças

Na sexta-feira, o par EUR/USD subiu para o nível 1,1374, se recuperou e reverteu a favor do dólar americano. Os ursos atacaram novamente, mas apenas brevemente, e, em geral, permaneceram

Samir Klishi 14:55 2025-05-05 UTC+2

Análise técnica do movimento intradiário de preços do índice Nasdaq 100, sexta-feira, 02 de maio de 2025

No gráfico de 4 horas do índice Nasdaq 100, o Oscilador Estocástico apresenta sinal de venda por cruzamento, enquanto se forma um padrão de cunha ascendente — uma configuração geralmente

Arief Makmur 15:53 2025-05-02 UTC+2

Sinais de negociação para o EUR/USD para 30 de abril de 2025: venda abaixo de 1,1376 (SMA 21 - 7/8 de Murray)

No início da sessão americana, o par EUR/USD está sendo negociado próximo de 1,1378, dentro de um canal de tendência de baixa formado em 17 de abril, e começa

Dimitrios Zappas 21:53 2025-04-30 UTC+2

Sinais de negociação para o OURO (XAU/USD) para 30 de abril de 2025: comprar acima de $3.270 (SMA 21 - 6/8 de Murray)

No início da sessão americana, o ouro está sendo negociado próximo a 3.384, acima do suporte principal e se recuperando após atingir 3.267. A expectativa é que o ouro recupere

Dimitrios Zappas 15:21 2025-04-30 UTC+2
Não pode falar agora?
Faça sua pergunta no chat.
Widget callback
 

Dear visitor,

Your IP address shows that you are currently located in the USA. If you are a resident of the United States, you are prohibited from using the services of InstaFintech Group including online trading, online transfers, deposit/withdrawal of funds, etc.

If you think you are seeing this message by mistake and your location is not the US, kindly proceed to the website. Otherwise, you must leave the website in order to comply with government restrictions.

Why does your IP address show your location as the USA?

  • - you are using a VPN provided by a hosting company based in the United States;
  • - your IP does not have proper WHOIS records;
  • - an error occurred in the WHOIS geolocation database.

Please confirm whether you are a US resident or not by clicking the relevant button below. If you choose the wrong option, being a US resident, you will not be able to open an account with InstaForex anyway.

We are sorry for any inconvenience caused by this message.