On Wednesday, the EUR/USD currency pair experienced a slight pullback but failed to consolidate below the moving average line. As per tradition, we will not analyze the outcome of the Federal Reserve meeting immediately after it concludes. We have explained our reasons multiple times: during the announcement of the Fed's decision and Jerome Powell's speech, the market traded impulsively and emotionally. It is common for the pair to make a sharp move in one direction, only to return to its original position the next day. Fed meeting-induced price movements sometimes distort the broader technical picture, rendering them random and irrelevant. Therefore, we will assess the Fed meeting's results and market reaction tomorrow.
Nothing has changed in the currency market yet. The Eurozone inflation report for February showed a slowdown to 2.6% YoY. What does this number mean? Simply put, the ECB can continue easing its monetary policy. The ECB never intended to stop its current course. Recently, there have been speculations that the ECB might pause in April, but these are still rumors.
It is important to understand that inflation is no longer the primary concern for the Eurozone—the main issue now is weak economic growth. If a trade war with the U.S. escalates, it could trigger a recession—and the trade war has already begun. It started gradually, with the U.S. imposing tariffs on steel and aluminum imports, affecting the EU and all countries. However, Brussels did not accept the U.S. explanation that these tariffs were "applied universally" and responded with counter-tariffs worth €26 billion. Donald Trump was infuriated that someone dared to retaliate and threatened to impose 25% tariffs on all EU imports. The market is waiting to see when these tariffs take effect and how the EU will respond.
We cannot predict the future, but at this point, it is clear that Donald Trump's actions, aimed at "benefiting the U.S.," are worsening its economic situation. The stock market is plunging, and the U.S. dollar has suffered significant losses. Perhaps this is part of Trump's grand strategy to revitalize the American economy, but it is difficult to expect any positive developments for now.
The market ignores any remaining positive factors because it views Trump's policies as a direct path to a recession—something even the Federal Reserve could not induce. The ongoing sell-off of the dollar and U.S. stocks now appears to be a personal protest against Trump. It seems that the situation will only get worse from here.
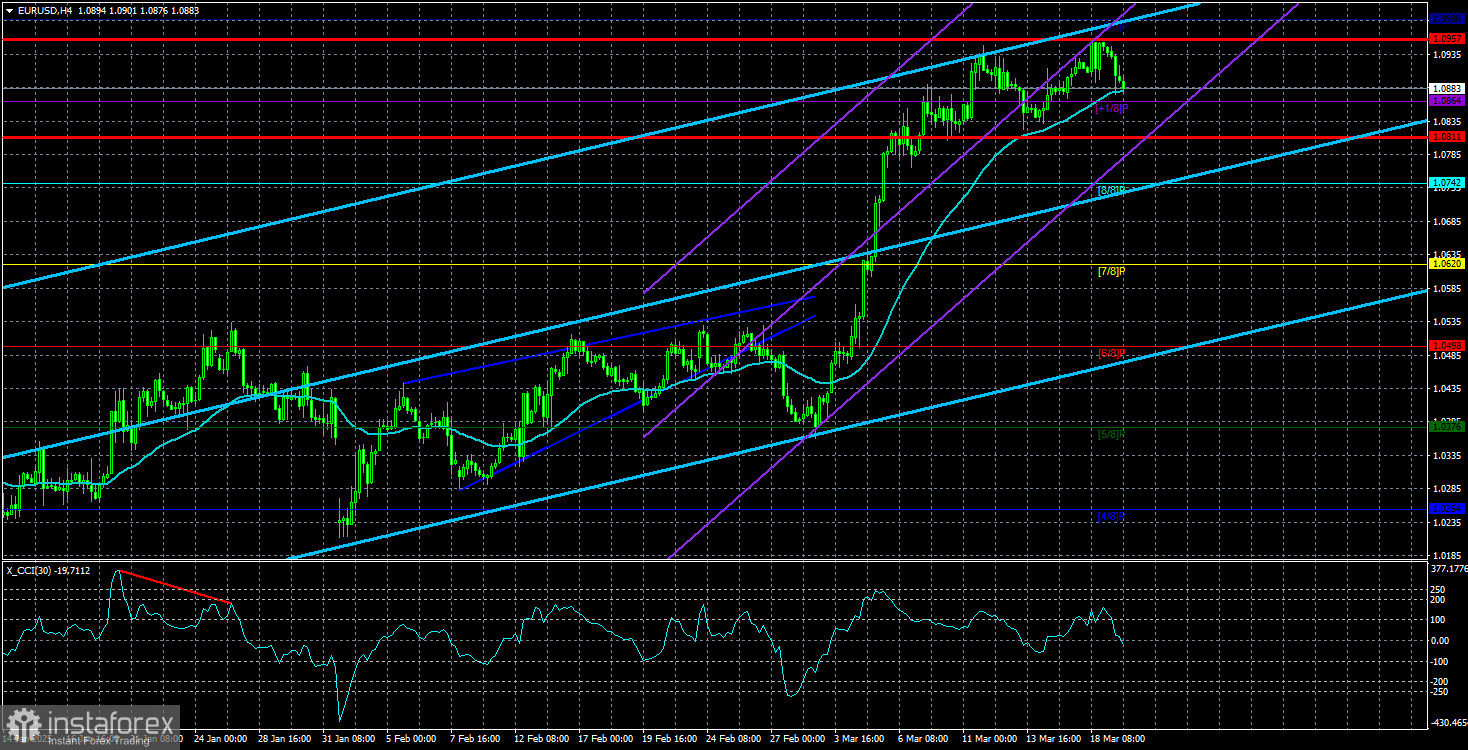
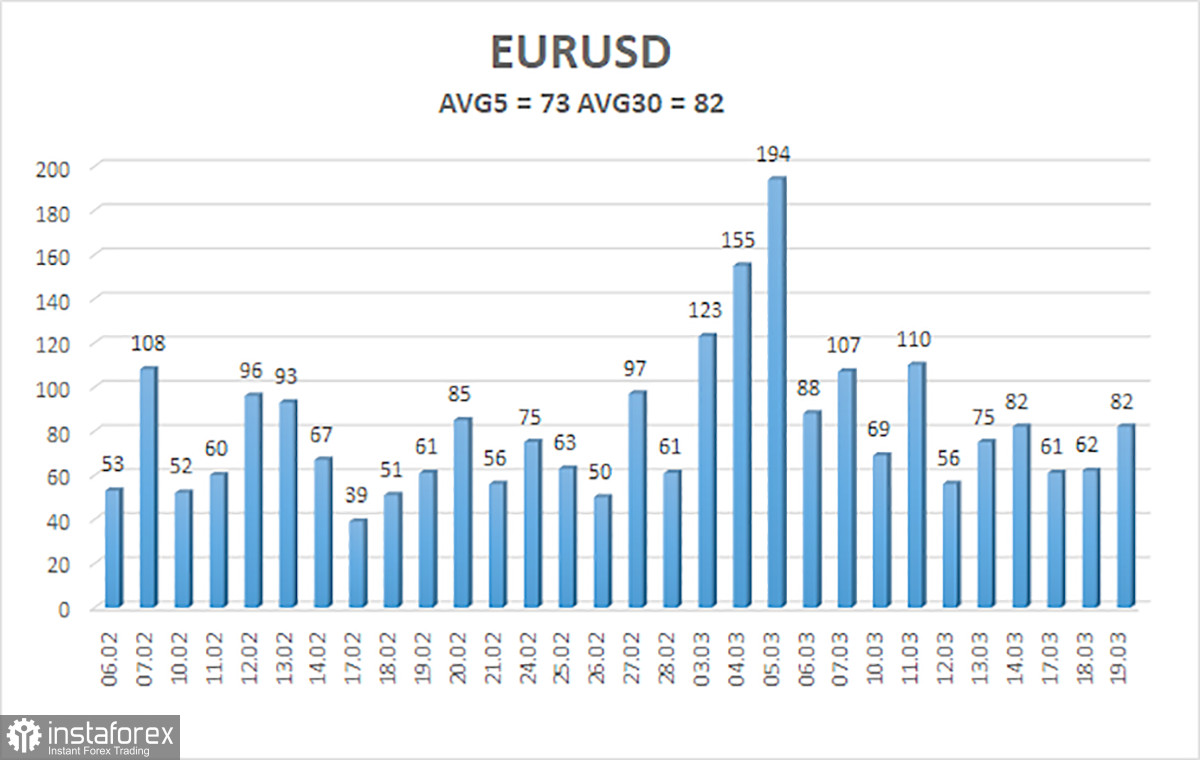
The average volatility of the EUR/USD currency pair over the last five trading days (as of March 20) is 73 pips, which is considered "moderate." We expect the pair to trade between 1.0811 and 1.0957 on Thursday. The long-term regression channel has turned upward, but the global downtrend remains intact, as seen in higher timeframes. The CCI indicator recently entered the oversold zone, signaling a new bullish correction that no longer looks like a correction.
Nearest Support Levels:
S1 – 1.0864
S2 – 1.0742
S3 – 1.0620
Nearest Resistance Levels:
R1 – 1.0986
Trading Recommendations:
The EUR/USD pair has broken out of a sideways range and continues to rise. For the past few months, we have consistently stated that we expect only a decline in the euro in the medium term, and nothing has changed. The U.S. dollar still has no fundamental reasons for a sustained medium-term decline—except for Donald Trump. Short positions remain more attractive, with targets at 1.0315 and 1.0254. However, it is difficult to say when this seemingly illogical rally will end. For those who trade using pure technical analysis, long positions above the moving average can be considered, with targets at 1.0957 and 1.0986.
Explanation of Illustrations:
Linear Regression Channels help determine the current trend. If both channels are aligned, it indicates a strong trend.
Moving Average Line (settings: 20,0, smoothed) defines the short-term trend and guides the trading direction.
Murray Levels act as target levels for movements and corrections.
Volatility Levels (red lines) represent the likely price range for the pair over the next 24 hours based on current volatility readings.
CCI Indicator: If it enters the oversold region (below -250) or overbought region (above +250), it signals an impending trend reversal in the opposite direction.