empty
 
 
03.03.2025 10:41 AM
Funds React with Growth Amid White House Scandal

This image is no longer relevant

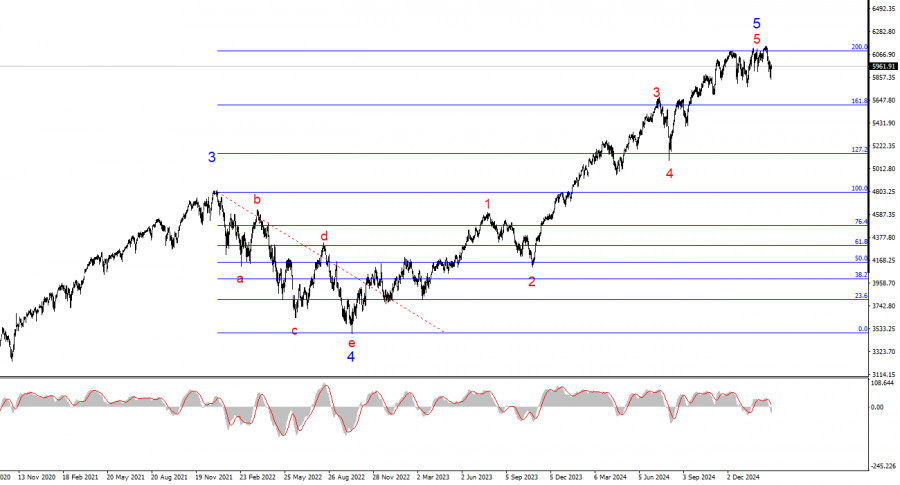
The wave structure on the 4-hour chart for #SPX appears uncertain but generally clear. The 24-hour chart reveals a global five-wave structure, so expansive that it does not fully fit within the terminal window even at the minimum scale. In simple terms, U.S. stock indices have been in an uptrend for a very long time. However, we know that trends eventually reverse. Currently, the formation of wave 5 in wave 5 is ongoing. The index has made four unsuccessful attempts to break above 6093, which corresponds to 200.0% Fibonacci retracement from wave 4. In my view, a new corrective wave or a series of corrections is likely in the near future. The U.S. stock market is overheated, and more analysts are beginning to talk about a "bubble."

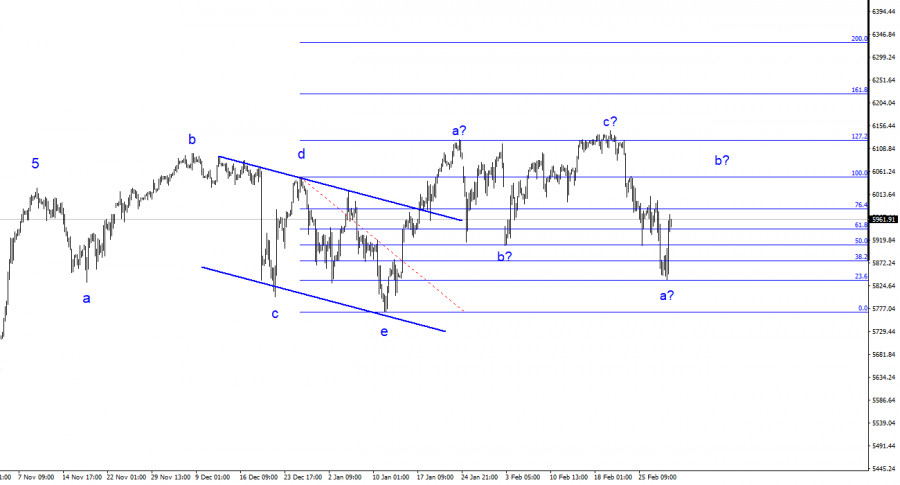
Switching to the 4-hour chart, we can observe a completed complex corrective structure (a-b-c-d-e) followed by a new upward wave structure in an a-b-c formation. This suggests that a new bearish structure is now forming, with wave b currently unfolding, after which further decline should resume. Another upward impulse could occur, but it would likely be followed by a more significant drop in the index. At this stage, I would rely more on the daily chart analysis.

The #SPX continues trading near historical peaks, and investors remain reluctant to exit their positions in major U.S. stocks. As I previously mentioned, the stock market entered a new bullish phase nearly two years ago, when U.S. inflation began slowing, and expectations of Federal Reserve monetary policy easing emerged. Now, this process is fully underway, and I would not expect further significant gains in U.S. stock indices as the market has already priced in these factors.

The fundamental backdrop for U.S. stock indices continues to deteriorate. The latest GDP report came in weaker than expected, indicating that the economy is slowing down. The Federal Reserve has essentially halted its monetary policy easing, whereas the stock market favors looser financial conditions and dislikes tightening. Stocks thrive in a dovish monetary environment or at least when easing is expected, which has been the case for the past two years.

Now, however, inflation in the U.S. is rising again, and Trump's policies are likely to accelerate it even further. The U.S. president's approach to international affairs is causing more investor concern than optimism. I still believe we are in for a prolonged and complex correction, making it unlikely that we will see further growth in stock indices.

Over the weekend, a scandal erupted at the White House involving Donald Trump and Volodymyr Zelensky. The fallout led to Ukraine backing out of a natural resources deal and the U.S. withdrawing further financial support for Ukraine. Over the past six weeks, almost every geopolitical development of this nature has fueled demand for U.S. stocks. However, I still expect SP500 and other indices to decline.

This image is no longer relevant

General Conclusions

Based on my #SPX analysis, I conclude that the index is nearing the end of its uptrend. Given the current situation, I suggest monitoring the 6125 level and Trump's economic policies. Trump is making decisions that threaten the stability of the U.S. economy and major American corporations, including trade wars, tariffs, and import restrictions. The likelihood of a new downtrend is increasing daily. The "bubble" in the U.S. stock market is at its peak. The 4-hour chart suggests another potential upward move before a drop, while the 24-hour chart points to the conclusion of the uptrend.

On the higher wave scale, the structure is much clearer—a five-wave bullish cycle with a five-wave pattern within the final wave. This fifth wave appears to be approaching its end. As a result, I would prepare for a prolonged and complex correction, which may have already begun.

Key Principles of My Analysis:

  1. Wave structures should be simple and clear. Complex formations are difficult to trade and often require adjustments.
  2. If you are uncertain about market conditions, it is better to stay out.
  3. There is never 100% certainty in market direction. Always use Stop-Loss orders to protect capital.
  4. Wave analysis can be combined with other analytical methods and trading strategies.
Chin Zhao,
انسٹافاریکس کا تجزیاتی ماہر
© 2007-2025
انسٹافاریکس کے ساتھ کرپٹو کرنسی کی معاملاتی تبدیلیوں سے کمائیں۔
میٹا ٹریڈر 4 ڈاؤن لوڈ کریں اور اپنی پہلی ٹریڈ کھولیں۔
  • Grand Choice
    Contest by
    InstaForex
    InstaForex always strives to help you
    fulfill your biggest dreams.
    مقابلہ میں شامل ہوں
  • چانسی ڈیپازٹ
    اپنے اکاؤنٹ میں 3000 ڈالر جمع کروائیں اور حاصل کریں$8000 مزید!
    ہم مارچ قرعہ اندازی کرتے ہیں $8000چانسی ڈیپازٹ نامی مقابلہ کے تحت
    اپنے اکاؤنٹ میں 3000 ڈالر جمع کروانے پر موقع حاصل کریں - اس شرط پر پورا اُترتے ہوئے اس مقابلہ میں شرکت کریں
    مقابلہ میں شامل ہوں
  • ٹریڈ وائز، ون ڈیوائس
    کم از کم 500 ڈالر کے ساتھ اپنے اکاؤنٹ کو ٹاپ اپ کریں، مقابلے کے لیے سائن اپ کریں، اور موبائل ڈیوائسز جیتنے کا موقع حاصل کریں۔
    مقابلہ میں شامل ہوں
  • 100 فیصد بونس
    اپنے ڈپازٹ پر 100 فیصد بونس حاصل کرنے کا آپ کا منفرد موقع
    بونس حاصل کریں
  • 55 فیصد بونس
    اپنے ہر ڈپازٹ پر 55 فیصد بونس کے لیے درخواست دیں
    بونس حاصل کریں
  • 30 فیصد بونس
    ہر بار جب آپ اپنا اکاؤنٹ ٹاپ اپ کریں تو 30 فیصد بونس حاصل کریں
    بونس حاصل کریں

تجویز کردہ مضامین

ابھی فوری بات نہیں کرسکتے ؟
اپنا سوال پوچھیں بذریعہ چیٹ.
Widget callback