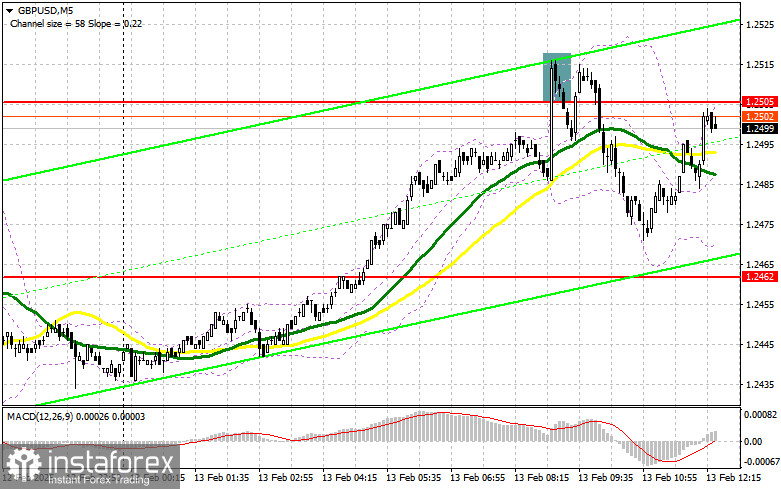
In my morning forecast, I focused on the 1.2505 level and planned to make trading decisions based on it. Let's examine the 5-minute chart to see what happened. A rise and false breakout at 1.2505 provided a strong short entry point, resulting in a 30+ point decline. The technical outlook has been revised for the second half of the session.
Long Position Strategy for GBP/USD:
News that UK GDP exceeded economists' forecasts triggered pound purchases, pushing GBP/USD to a new daily high. However, the rally quickly faded, as stronger economic growth may prompt further rate cuts by the Bank of England, which could negatively impact the pair's bullish prospects.
In the second half of the session, U.S. inflation data will be released, including the Producer Price Index (PPI) and core PPI. If these indicators rise, mirroring yesterday's trend, pressure on the pound will return, forcing buyers to defend the 1.2473 support level.
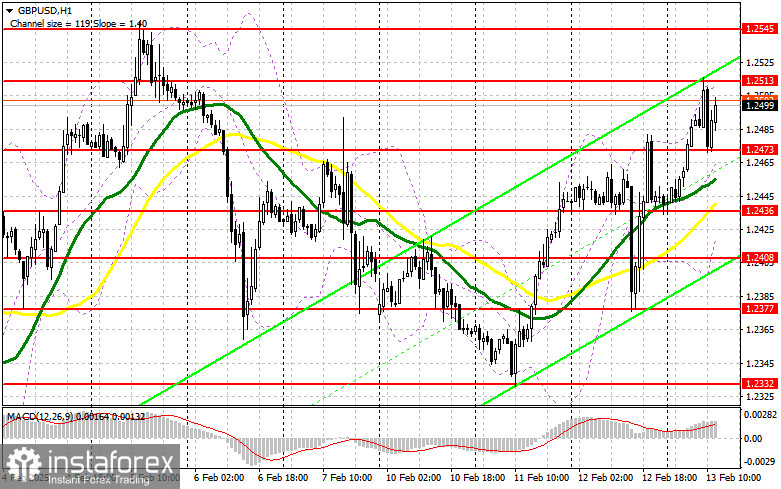
I will open long positions only after a false breakout at 1.2473, targeting 1.2513, a resistance level formed earlier in the day. A break and retest of this range will confirm a new buying opportunity, potentially pushing GBP/USD to 1.2545, reinforcing bullish prospects. The final target will be 1.2592, where I will lock in profits.
If GBP/USD falls and there is no buyer activity at 1.2473, the pressure on the pound will increase, though this will not yet be a major issue for buyers. In this case, a false breakout at 1.2436 will serve as a suitable entry for long positions. I also plan to buy immediately on a rebound from 1.2408, targeting a 30-35 point intraday correction.
Short Position Strategy for GBP/USD:
Sellers made their presence felt, signaling that they are not willing to give full control to the bulls. If GBP/USD attempts another rise, I will watch the 1.2513 resistance level for a false breakout, confirming a short position, aiming for 1.2473. Just below this level, the 30- and 50-period moving averages support the bulls.
A break and retest of 1.2473 from below will trigger stop-loss orders, opening the way to 1.2436. The final downward target will be 1.2408, where I will take profits.
If demand for the pound remains strong after U.S. inflation data, and sellers fail to act at 1.2513, GBP/USD will likely extend its rally. In that case, I will wait for a test of 1.2545 before entering short positions on a false breakout. If no bearish reaction occurs there, I will look for short entries around 1.2592, but only for a 30-35 point intraday correction.
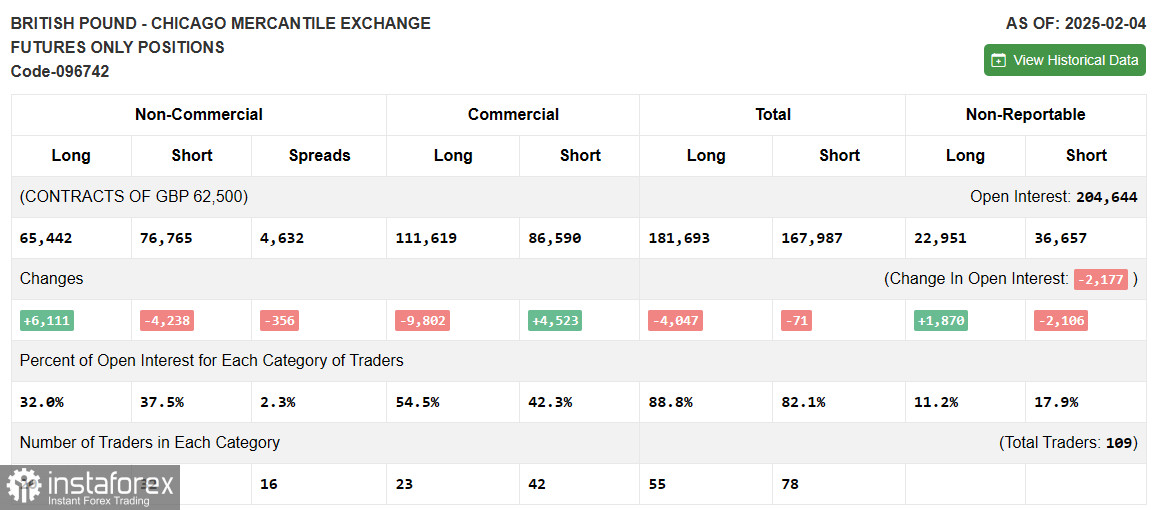
Commitment of Traders (COT) Report Analysis:
The February 4 COT report showed a decline in short positions and an increase in long positions. However, this should not be taken as a clear signal for pound appreciation.
This report does not yet reflect the Bank of England's rate cut decision and its increasingly dovish stance. The recent GBP rally was merely a correction, while the fundamental pressure on the pair remains. Additionally, new U.S. trade measures will continue to pressure risk assets, maintaining demand for the U.S. dollar. Long non-commercial positions increased by 6,111 to 65,442 Short non-commercial positions decreased by 4,238 to 76,765 The gap between long and short positions narrowed by 356.
Indicator Signals
Moving Averages
GBP/USD is trading above the 30- and 50-day moving averages, signaling potential further upside.
Note: The author uses H1 chart moving averages, which may differ from traditional daily moving averages on the D1 chart.
Bollinger Bands
If GBP/USD declines, the lower Bollinger Band near 1.2436 will serve as support.
Technical Indicator Descriptions:
- Moving Average (MA) – identifies the current trend by smoothing out volatility and noise.
- 50-period MA (yellow on the chart)
- 30-period MA (green on the chart)
- MACD (Moving Average Convergence/Divergence) – identifies trend momentum.
- Fast EMA: 12-period
- Slow EMA: 26-period
- SMA: 9-period
- Bollinger Bands (BB) – measures volatility and overbought/oversold conditions.
- Non-commercial traders – speculators, including retail traders, hedge funds, and institutional investors, using futures markets for speculative purposes.
- Long non-commercial positions – total long open positions among non-commercial traders.
- Short non-commercial positions – total short open positions among non-commercial traders.
- Net non-commercial position – the difference between long and short positions of non-commercial traders.