empty
 
 
13.02.2025 12:28 PM
EUR/USD – February 13th: The Euro Moves Into a Sideways Trend

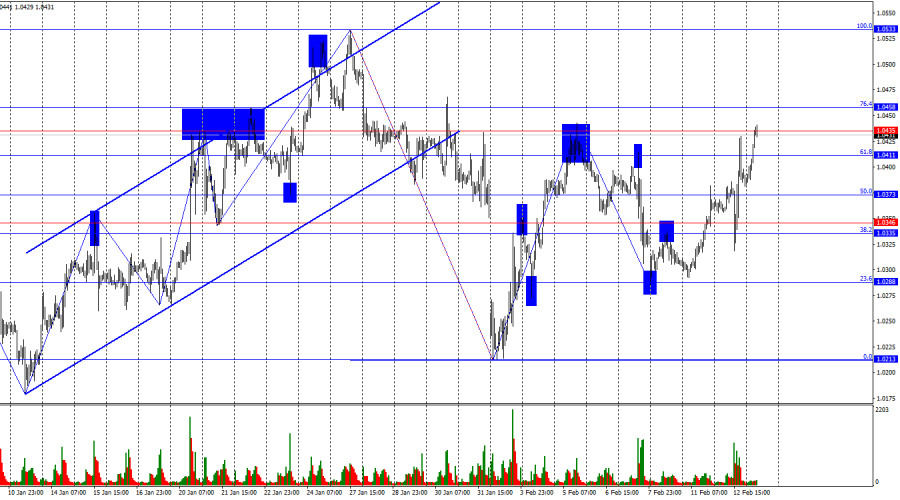
The EUR/USD pair continued its upward movement on Wednesday, reaching the 1.0435 level on Thursday. A rejection from this level would favor the U.S. dollar, resuming the decline toward the support zone at 1.0335–1.0346 and possibly lower.

This image is no longer relevant

The pair's movements increasingly resemble a sideways range, particularly noticeable on the 4-hour chart. A break and consolidation above 1.0435 would suggest a continuation of euro appreciation.

On the hourly chart, the wave structure has become uncertain. The most recent downward wave failed to break the previous low, and the latest upward wave failed to exceed the previous peak. This suggests that the trend has turned bearish or that we are witnessing a complex horizontal movement. The inconsistency in wave sizes further raises doubts about the presence of a clear trend.

Wednesday's fundamental backdrop was highly significant, yet traders failed to react decisively. This may indicate that most market participants are not considering buying the dollar at the moment.

Nonetheless, U.S. inflation accelerated in both the headline and core Consumer Price Index (CPI). The increase in inflation makes it highly unlikely that the Federal Reserve (FOMC) will cut interest rates before the summer. Moreover, if inflation remains persistently high, even a summer rate cut may not materialize.

In other words, given current inflation levels, the Fed is unlikely to consider monetary policy easing at all. Only a consistent decline in inflation over time could reignite discussions about rate cuts. Until then, the U.S. central bank will likely maintain its current restrictive stance.

Thus, bullish traders had a great opportunity to push the euro higher yesterday, but bears ultimately took control. This outcome is somewhat surprising, reinforcing the likelihood of a sideways market.

This image is no longer relevant

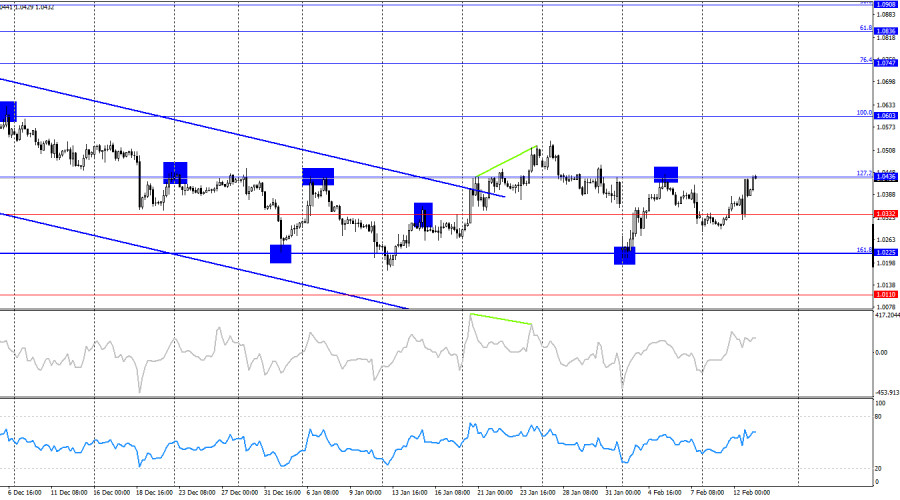
On the 4-hour chart, the pair returned to the 127.2% Fibonacci retracement level at 1.0436. A rejection from this level would support the U.S. dollar and signal a renewed decline toward the 161.8% Fibonacci level at 1.0225.

So far, the 2025 trading pattern has been predominantly sideways. This means that a new decline in the euro could begin from current levels or slightly higher.

Commitments of Traders (COT) Report

This image is no longer relevant

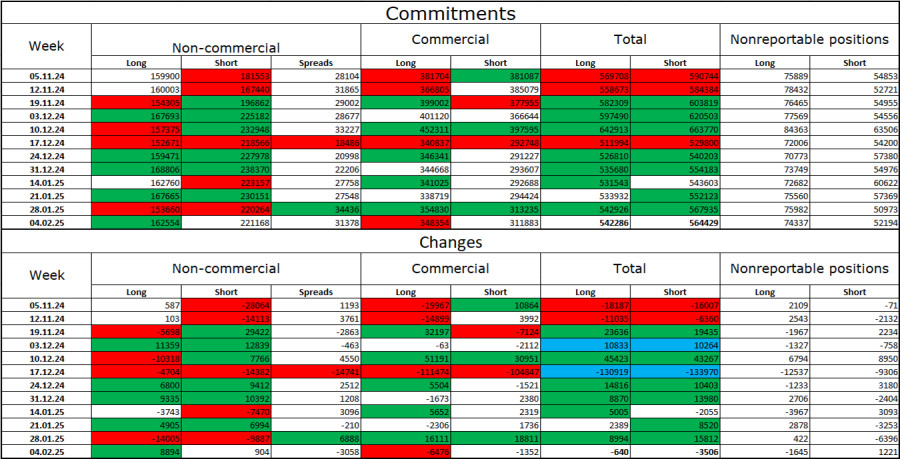
In the latest reporting week, professional traders added 8,894 long positions and 904 short positions. Despite this, the overall sentiment in the "Non-commercial" category remains bearish, suggesting a continuation of the pair's downtrend. Total long positions among speculators: 162,000. Total short positions: 221,000.

For 20 consecutive weeks, large traders have been reducing their euro holdings, reinforcing a bearish trend without exception. Occasionally, bullish sentiment dominates in individual weeks, but these instances are exceptions rather than a shift in trend.

The key driver of the dollar's previous decline—expectations of Fed rate cuts—has already been priced in. There are currently no strong reasons for the market to continue selling the dollar. While these reasons may emerge over time, for now, the likelihood of further dollar strength remains higher.

Technical analysis also confirms the continuation of a long-term bearish trend, reinforcing my expectation of a further EUR/USD decline.

Economic Calendar for the Eurozone & U.S.

  • Germany – Consumer Price Index (CPI) (07:00 UTC)
  • Eurozone – Industrial Production Change (10:00 UTC)
  • U.S. – Producer Price Index (PPI) (13:30 UTC)
  • U.S. – Initial Jobless Claims (13:30 UTC)

February 13's economic calendar contains four scheduled events, but none are considered major. As a result, the overall market impact may remain limited throughout the day.

EUR/USD Forecast & Trading Recommendations

Selling opportunities are valid on a rejection from 1.0435, with targets at 1.0373 and 1.0346. Buying opportunities are not recommended, as the pair is likely trading within a sideways range near its upper boundary.

Fibonacci Levels

  • Hourly chart: 1.0533–1.0213
  • 4-hour chart: 1.0603–1.1214
Samir Klishi,
انسٹافاریکس کا تجزیاتی ماہر
© 2007-2025
انسٹافاریکس کے ساتھ کرپٹو کرنسی کی معاملاتی تبدیلیوں سے کمائیں۔
میٹا ٹریڈر 4 ڈاؤن لوڈ کریں اور اپنی پہلی ٹریڈ کھولیں۔
  • Grand Choice
    Contest by
    InstaForex
    InstaForex always strives to help you
    fulfill your biggest dreams.
    مقابلہ میں شامل ہوں
  • چانسی ڈیپازٹ
    اپنے اکاؤنٹ میں 3000 ڈالر جمع کروائیں اور حاصل کریں$1000 مزید!
    ہم فروری قرعہ اندازی کرتے ہیں $1000چانسی ڈیپازٹ نامی مقابلہ کے تحت
    اپنے اکاؤنٹ میں 3000 ڈالر جمع کروانے پر موقع حاصل کریں - اس شرط پر پورا اُترتے ہوئے اس مقابلہ میں شرکت کریں
    مقابلہ میں شامل ہوں
  • ٹریڈ وائز، ون ڈیوائس
    کم از کم 500 ڈالر کے ساتھ اپنے اکاؤنٹ کو ٹاپ اپ کریں، مقابلے کے لیے سائن اپ کریں، اور موبائل ڈیوائسز جیتنے کا موقع حاصل کریں۔
    مقابلہ میں شامل ہوں
  • 100 فیصد بونس
    اپنے ڈپازٹ پر 100 فیصد بونس حاصل کرنے کا آپ کا منفرد موقع
    بونس حاصل کریں
  • 55 فیصد بونس
    اپنے ہر ڈپازٹ پر 55 فیصد بونس کے لیے درخواست دیں
    بونس حاصل کریں
  • 30 فیصد بونس
    ہر بار جب آپ اپنا اکاؤنٹ ٹاپ اپ کریں تو 30 فیصد بونس حاصل کریں
    بونس حاصل کریں

تجویز کردہ مضامین

ابھی فوری بات نہیں کرسکتے ؟
اپنا سوال پوچھیں بذریعہ چیٹ.
Widget callback