empty
 
 
14.02.2025 01:10 PM
GBP/USD. February 14th. Donald Trump Announces New Tariffs

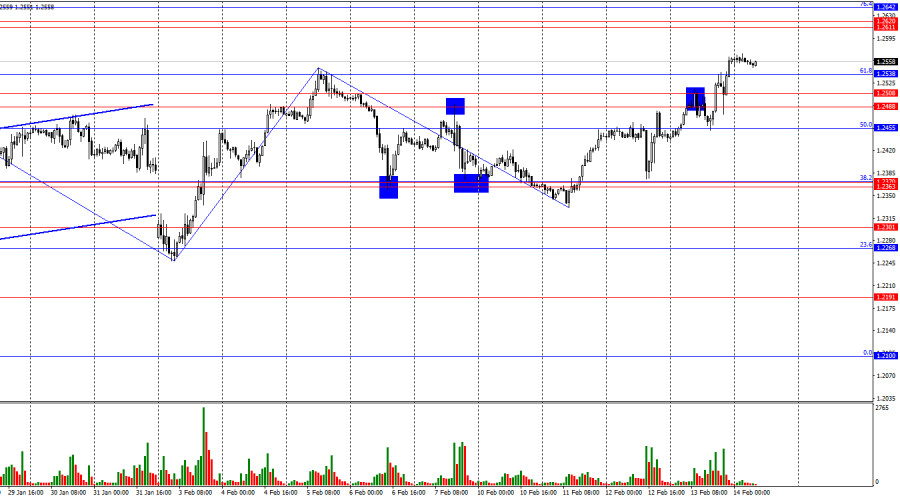
On the hourly chart, the GBP/USD pair continued its upward movement on Thursday and consolidated above the Fibonacci 61.8% level – 1.2538 based on the new Fibonacci retracement grid. This suggests that the growth process may extend towards the next resistance zone at 1.2611–1.2620. A consolidation below 1.2538 would favor the U.S. dollar, though a strong support zone at 1.2488–1.2508 is located just below. The bullish trend remains intact for now.

This image is no longer relevant

The wave structure is clear. The last completed downward wave did not break below the previous low, while the last completed upward wave surpassed the previous peak. This suggests that the formation of a bullish trend is still ongoing. However, recent waves have varied significantly in size and present multiple structural possibilities. I am not convinced that we are currently in a sustainable bullish trend that will continue for at least a few more weeks.

The fundamental backdrop on Thursday supported further bullish momentum. The UK GDP and industrial production reports showed relatively weak figures, but they exceeded traders' expectations. While it is too early to discuss a full economic recovery in the UK—given its sluggish growth—this data provided a glimmer of hope, which bulls eagerly seized.

Additionally, reports emerged yesterday that Donald Trump's administration is preparing new tariff packages. It is highly likely that tariffs will soon be announced on imports from the European Union, which remains one of the last economies in the "untouched list." Notably, this news did not trigger U.S. dollar growth, whereas in the past, dollar appreciation typically followed announcements of new Trump tariffs. The British pound's recovery is ongoing, though not entirely stable or predictable, yet the current bullish trend is evident. As a result, I do not anticipate a sharp decline in the pound at this stage.

This image is no longer relevant

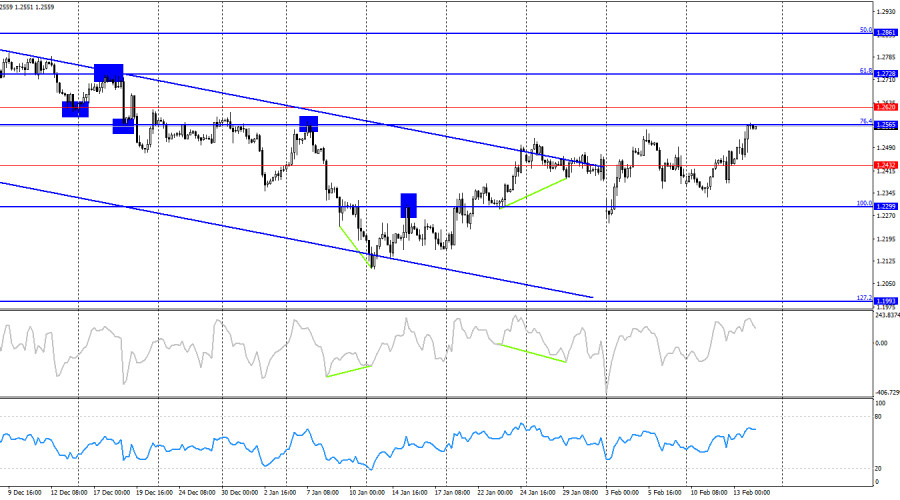
On the 4-hour chart, the pair continues to trade sideways between 1.2299 and 1.2565. I believe it is more reliable to focus on the hourly chart for now, as the 4-hour chart increasingly signals range-bound movement. A rebound from the 1.2565 level would favor the U.S. dollar and could initiate a decline toward 1.2432. As of today, no impending divergences are observed on any indicators.

Commitments of Traders (COT) Report

This image is no longer relevant

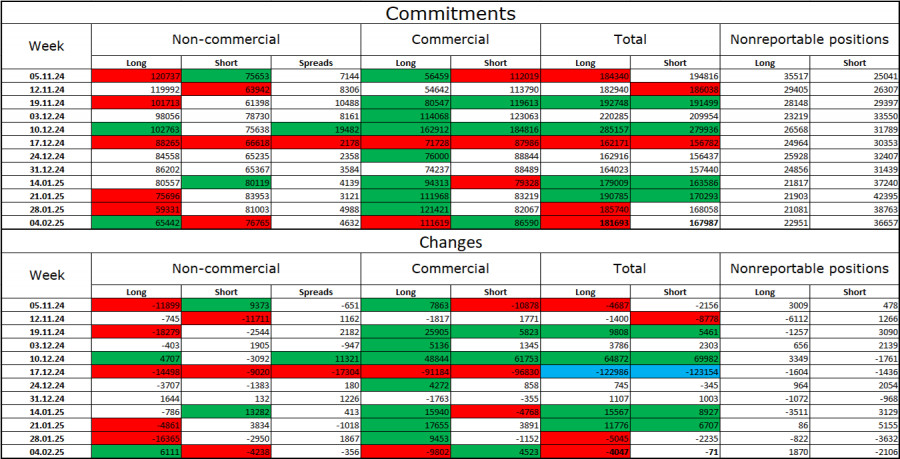
The sentiment among non-commercial traders has become less bearish over the past reporting week. The number of long positions held by speculators increased by 6,111, while the number of short positions decreased by 4,238. Bulls have completely lost their market advantage—a process that has lasted several months. The gap between long and short positions still favors the bears: 65,000 vs. 76,000.

From my perspective, the pound remains susceptible to further declines, and COT reports indicate strengthening bearish positions almost every week. Over the past three months, the number of long positions has dropped from 120,000 to 65,000, while short positions have increased from 75,000 to 76,000. I believe that professional traders will continue to liquidate long positions or increase shorts, as all potential bullish factors for the British pound have already been priced in. Currently, technical analysis signals further upside potential, but corrections should also be expected.

Economic Calendar for the U.S. and the UK

  • U.S. – Retail Sales Change (13:30 UTC)
  • U.S. – Industrial Production Change (14:15 UTC)

Friday's economic calendar contains two moderately significant events. The impact of these reports on trader sentiment for the remainder of the day may be limited.

GBP/USD Forecast and Trading Recommendations

Selling opportunities arise today if the pair rejects the 1.2565 level on the 4-hour chart, with targets at 1.2488 and 1.2455 on the hourly chart. Buying opportunities were previously available upon consolidation above the 1.2363–1.2370 zone on the hourly chart, with targets at 1.2488–1.2508. Since this target has been reached, I would not consider new buy positions at this stage.

The Fibonacci retracement grids are drawn between 1.2809–1.2100 on the hourly chart and 1.2299–1.3432 on the 4-hour chart.

Jana pendapatan melalui perubahan kadar mata wang kripto dengan InstaForex.
Muat turun MetaTrader 4 dan buka dagangan pertama anda.
  • Grand Choice
    Contest by
    InstaForex
    InstaForex always strives to help you
    fulfill your biggest dreams.
    SERTAI PERADUAN
  • Chancy Deposit
    Deposit akaun anda sebanyak $3,000 dan dapatkan $1000 lebih lagi!
    Dalam Februari kami membuat cabutan bertuah $1000 dalam Kempen Chancy Deposit!
    Dapatkan peluang untuk menang dengan membuat deposit $ 3000 ke dalam akaun dagangan. Setelah memenuhi syarat ini, anda menjadi peserta kempen.
    SERTAI PERADUAN
  • Trade Wise, Win Device
    Daftar untuk peraduan dan tambah dana akaun anda dengan sekurang-kurangnya AS$ 500 untuk layak memenangi peranti mudah alih.
    SERTAI PERADUAN
  • Bonus 100%
    Peluang istimewa anda untuk menerima bonus 100% pada deposit anda
    DAPATKAN BONUS
  • Bonus 55%
    Dapatkan bonus 55% pada setiap deposit anda
    DAPATKAN BONUS
  • Bonus 30%
    Dapatkan bonus 30% setiap kali anda membuat penambahan dana akaun anda
    DAPATKAN BONUS

Artikel yang dicadangkan

Tidak boleh bertanya sekarang?
Tanya soalan anda di Ruangan bersembang.
Panggilan semula Widget