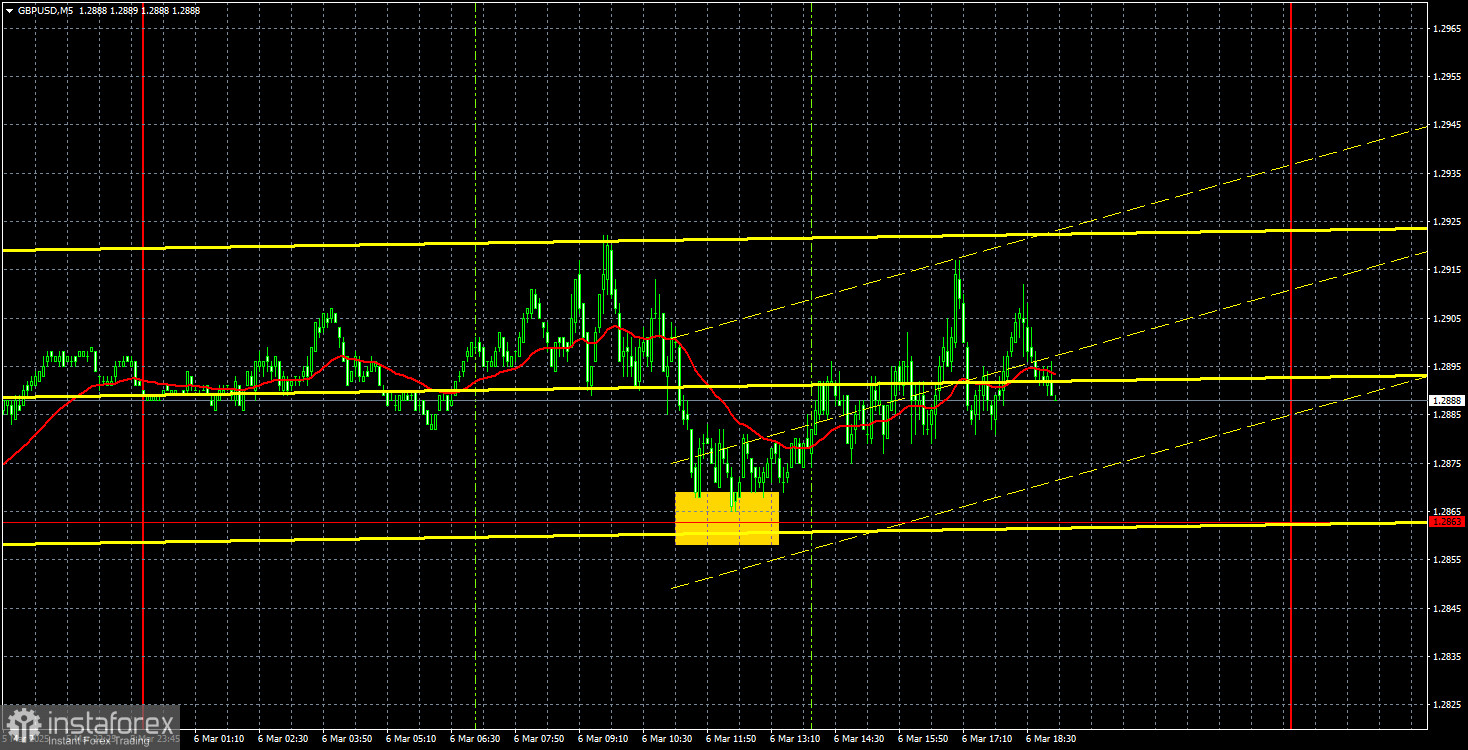
GBP/USD 5M Analysis
On Thursday, GBP/USD stayed in a tight range, reflecting a market pause. There were no significant economic releases from the UK, and Bank of England Governor Andrew Bailey's recent remarks offered little insight to traders. Bailey only emphasized that trade disputes should be resolved through dialogue rather than tariffs, a statement unlikely to influence decision-making in the White House.
In the U.S., no major economic events took place either, which temporarily halted the dollar's decline. However, Friday is set to bring high-impact reports, including key labor market and unemployment data, alongside a speech from Federal Reserve Chair Jerome Powell. If U.S. labor data disappoints or Powell signals a dovish shift, the dollar may face renewed selling pressure. Market sentiment remains unpredictable, with traders disregarding some fundamental factors, so surprises cannot be ruled out.
Only one trading signal emerged for GBP/USD on Thursday. The pair tested 1.2863 and rebounded, providing an entry opportunity for long positions. Unlike earlier in the week, however, the movement was less pronounced, but traders could still capture a few dozen points from this setup.
COT Report Analysis
Commitments of Traders (COT) reports for GBP/USD indicate frequent shifts in market sentiment among commercial traders. The red and blue lines, representing net positions of commercial and non-commercial traders, continue to cross frequently, often hovering near the zero line, suggesting a balance between buying and selling interest.
On the weekly timeframe, the price initially broke below 1.3154 before falling toward a trendline, which it subsequently breached. This suggests that the downtrend is likely to continue. However, the pair bounced off a previous local low, raising the possibility of a range-bound phase (flat market).
The latest COT report shows that non-commercial traders opened 0.5K buy contracts while closing 4.5K sell contracts, leading to a net position increase of 5K contracts. However, this does not provide a strong bullish signal for GBP/USD.
Fundamentally, the pound lacks strong support for sustained long-term growth, and the global downtrend remains intact. A declining net position could signal reduced demand for GBP, reinforcing the bearish outlook.
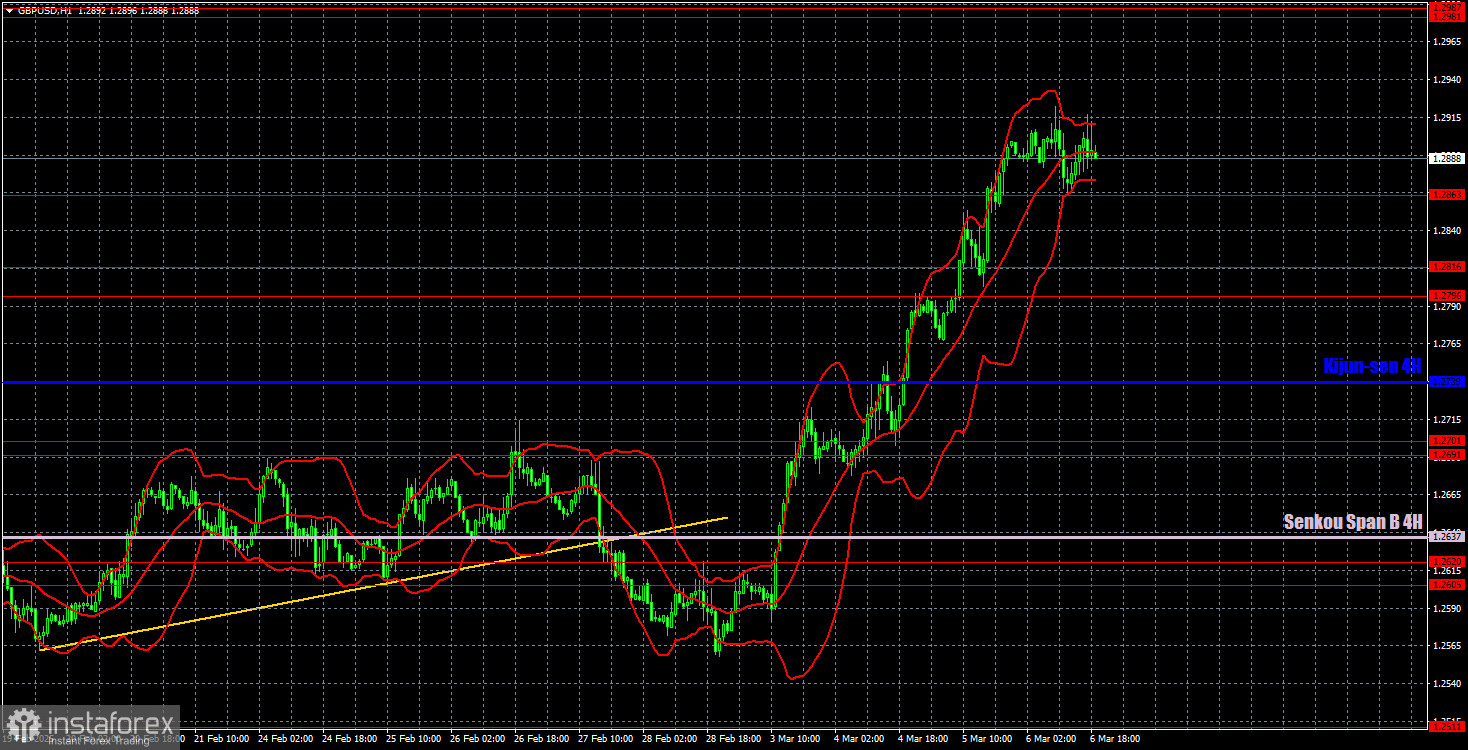
GBP/USD 1H Analysis
On the hourly timeframe, GBP/USD continues its upward trend, which largely reflects the dollar's decline rather than inherent pound strength. This move may be one of several corrective phases within the broader downtrend on the daily timeframe.
Currently, the only factor supporting GBP is Donald Trump's policy approach, which seems to be deliberately weakening the dollar. Other market drivers appear ignored by traders, reinforcing the idea that the recent rally is speculative rather than fundamentally driven.
Key Trading Levels for March 7
- Support and Resistance Zones: 1.2237-1.2255, 1.2331-1.2349, 1.2429-1.2445, 1.2511, 1.2605-1.2620, 1.2691-1.2701, 1.2796-1.2816, 1.2863, 1.2981-1.2987, 1.3050.
- Ichimoku Indicator Levels: Senkou Span B at 1.2637 and Kijun-sen at 1.2739, which can act as support/resistance.
- Stop Loss Consideration: Move to breakeven after a 20-point move in the right direction.
- Ichimoku Lines may shift intraday, so traders should monitor their real-time positioning.
Market Outlook for March 7
There are no major UK economic releases scheduled, but three key U.S. events will dominate the session:
- NonFarm Payrolls (NFP) report
- Unemployment rate release
- Jerome Powell's speech
Market reaction to weak U.S. data could further weaken the dollar, while strong figures may not necessarily trigger a meaningful rebound, given the ongoing dollar selloff.
On Thursday, despite conditions favoring a euro decline, the EUR/USD pair barely moved, highlighting the market's unpredictable nature.
Explanation of Chart Elements
- Support and Resistance Levels (bold red lines): Areas where price action may stall or reverse, but not direct trading signals.
- Ichimoku Kijun-sen and Senkou Span B Lines: Strong support/resistance levels, adjusted for the hourly timeframe from the 4-hour chart.
- Extreme Levels (thin red lines): Previous bounce points that serve as potential trading signals.
- Yellow Lines: Trendlines, channels, and technical patterns.
- COT Indicator: Displays the net position of trader categories.