Analysis of Trades and Trading Tips for the Euro
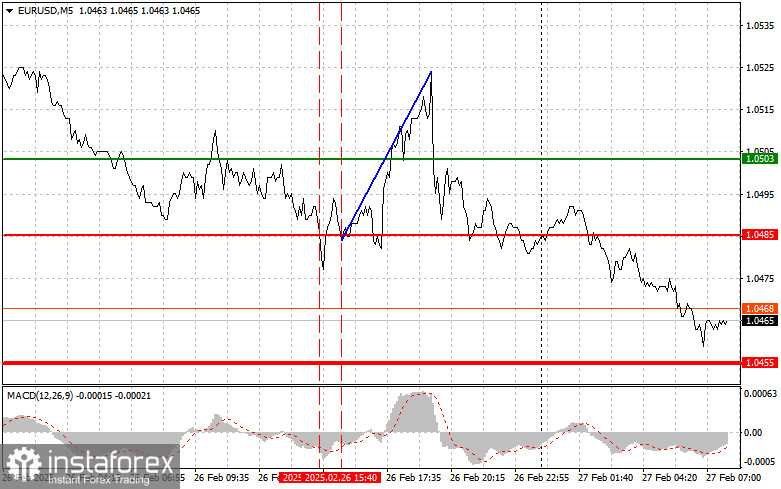
The test of the 1.0485 price level occurred when the MACD indicator had already moved significantly below the zero mark, which limited the downward potential of the euro. For this reason, I chose not to sell the euro. The second test of this price level, which happened shortly after, coincided with the MACD being in the oversold zone and starting to recover, providing an opportunity to execute Scenario #2, which involved buying the euro. As a result, the euro rose by 40 pips.
However, markets reacted quickly when Trump announced that he would impose a 25% tariff on all goods from the EU. Investors, fearing a trade war between the US and the EU, began to sell off the euro and shifted their investments to what they considered more reliable dollar-denominated assets.
Trump's statements triggered a wave of criticism from European politicians and economists, many of whom described them as irresponsible and populist. They accused the US president of intentionally destabilizing the global economy. Representatives of the European Commission expressed their readiness to retaliate with mirror measures, raising concerns about the potential escalation of the trade conflict.
Given this situation, further volatility in currency markets is expected.
Today's data on changes in the eurozone's M3 money supply and private sector lending are unlikely to cause significant movement in the euro, but they should still be analyzed. The growth of M3, which includes cash in circulation, deposits, and short-term money market instruments, is often seen as a leading indicator of inflation. An increase in private sector lending, whether to businesses or households, fuels this growth, as new loans increase the amount of money in the economy.
The European Central Bank's monetary policy meeting report, which will also be released today, will provide a detailed analysis of the current economic situation, including M3 dynamics and lending trends. It will explain the decisions made and allow for some forecasts of future actions. Traders and analysts will likely examine this report closely for signals about the ECB's next steps.
Regarding intraday strategy, I will primarily rely on Scenario #1 and Scenario #2.
Buy Signal
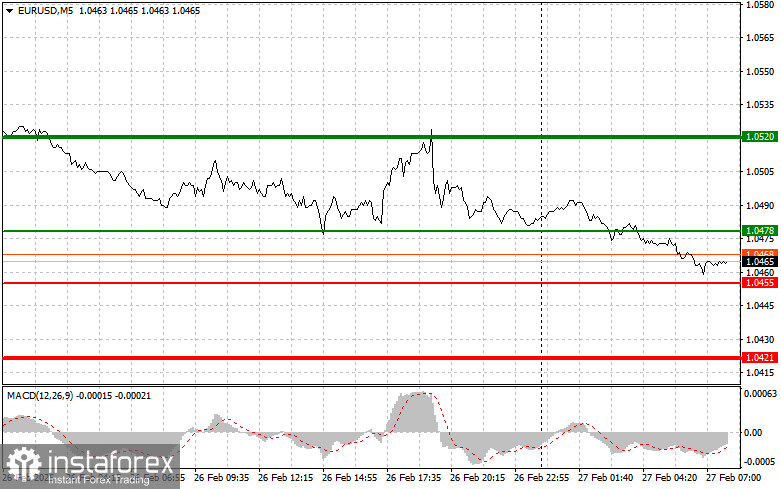
Scenario #1: Today, I plan to buy the euro at the 1.0478 level (green line on the chart), targeting a rise to 1.0520. At 1.0520, I plan to exit the market and sell the euro in the opposite direction, expecting a 30-35 pips movement from the entry point. Betting on euro growth in the first half of the day will only be reasonable with strong eurozone data. Important! Before buying, make sure the MACD indicator is above the zero mark and just beginning to rise.
Scenario #2: I also plan to buy the euro today if there are two consecutive tests of the 1.0455 price level when the MACD is in the oversold zone. This will limit the pair's downward potential and trigger an upward market reversal. Growth can be expected toward the opposite levels of 1.0478 and 1.0520.
Sell Signal
Scenario #1: I plan to sell the euro after reaching the 1.0455 level (red line on the chart). The target will be 1.0421, where I plan to exit the market and buy immediately in the opposite direction (expecting a 20-25 pips movement back). Pressure on the pair will return today if there is very weak economic data. Important! Before selling, ensure the MACD indicator is below the zero mark and beginning to decline.
Scenario #2: I also plan to sell the euro today if there are two consecutive tests of the 1.0478 price level when the MACD is in the overbought zone. This will limit the pair's upward potential and trigger a market reversal downward. A decline toward the opposite levels of 1.0455 and 1.0421 can be expected.
What's on the Chart:
- The thin green line represents the entry price where the trading instrument can be bought.
- The thick green line indicates the expected price level where a Take Profit order can be placed, or profits can be manually secured, as further price growth above this level is unlikely.
- The thin red line represents the entry price where the trading instrument can be sold.
- The thick red line indicates the expected price level where a Take Profit order can be placed, or profits can be manually secured, as further price decline below this level is unlikely.
- The MACD indicator should be used to assess overbought and oversold zones when entering the market.
Important Notes:
- Beginner Forex traders should exercise extreme caution when making market entry decisions. It is advisable to stay out of the market before the release of important fundamental reports to avoid exposure to sharp price fluctuations. If you choose to trade during news releases, always use stop-loss orders to minimize potential losses. Trading without stop-loss orders can quickly wipe out your entire deposit, especially if you neglect money management principles and trade with high volumes.
- Remember, successful trading requires a well-defined trading plan, similar to the one outlined above. Making impulsive trading decisions based on the current market situation is a losing strategy for intraday traders.