Analysis of Trades and Trading Tips for the Euro
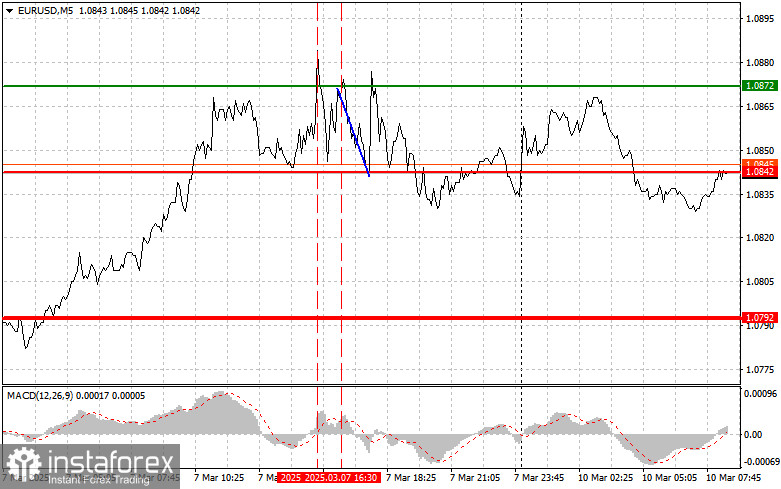
The first test of the 1.0872 price level occurred when the MACD indicator had already risen significantly above the zero mark, which limited the pair's upward potential. For this reason, I did not buy the euro. Shortly afterward, the second test of 1.0872 coincided with MACD being in the overbought zone, allowing scenario #2 for selling to play out, leading to a 30-pip drop in the euro.
The U.S. unemployment rate increased and worsened than economists' forecasts, triggering dollar selling. However, this did not result in a significant rise in the EUR/USD pair. Despite negative labor market data, the strong aspects of the U.S. economy, such as stable consumer demand, may limit the dollar's decline. Additionally, market attention is shifting toward the upcoming Federal Reserve meeting, where new signals regarding interest rates may be provided. In contrast, Europe continues to face uncertainty regarding economic growth and inflation, which dampens enthusiasm for the euro.
Today is packed with economic releases. Germany will report on changes in its industrial sector and trade balance, while Sentix will publish the Eurozone investor confidence index. Only a significant increase in industrial production can boost demand for the euro. Otherwise, the downward trend in EUR/USD, which emerged after positive U.S. labor market data release, may intensify. Investors, concerned about recent statements from European Central Bank officials, are actively seeking opportunities to sell the euro.
Expectations for the German industry remain cautious as the energy crisis and logistical problems continue negatively impacting the manufacturing sector. If the data comes in worse than expected, the euro could face another wave of selling. The trade balance will also be closely analyzed. A decline in exports or an increase in imports could indicate a weakening German economy and intensify negative sentiment toward the euro. The Sentix index, despite being a leading indicator, is less important in the current environment compared to actual production and trade data. Nevertheless, a substantial increase in the index could provide minor support for the euro, reducing selling pressure.
For intraday strategy, I will focus more on implementing Scenarios #1 and #2.
Buy Signal
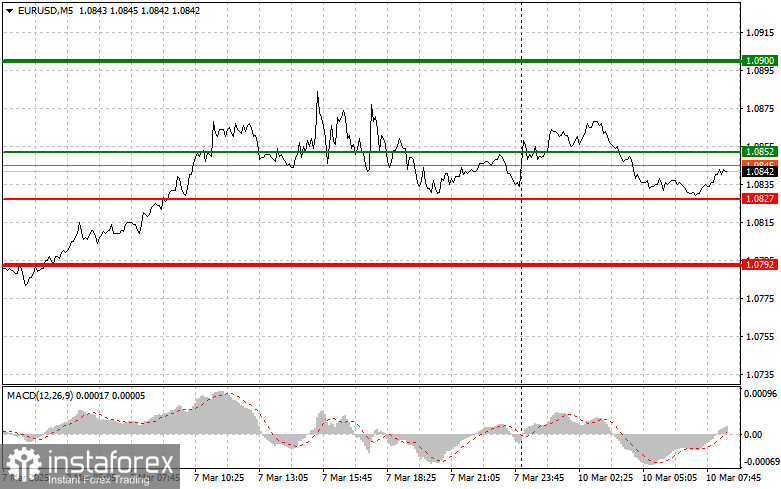
Scenario #1: Today, I plan to buy the euro when the price reaches around 1.0852 (green line on the chart), aiming for an increase toward 1.0900. At 1.0900, I plan to exit the market and sell the euro in the opposite direction, expecting a 30-35 pip move from the entry point. Expecting euro growth in the first half of the day is only reasonable if the Eurozone releases strong economic data. Important! Before buying, ensure that the MACD indicator is above the zero mark and beginning to rise.
Scenario #2: I also plan to buy the euro today if there are two consecutive tests of the 1.0827 level when the MACD indicator is in the oversold zone. This will limit the pair's downward potential and trigger an upward market reversal. A rise toward the opposite levels of 1.0852 and 1.0900 can be expected.
Sell Signal
Scenario #1: I plan to sell the euro after it reaches the 1.0827 level (red line on the chart). The target will be 1.0792, where I intend to exit the market and immediately buy in the opposite direction, expecting a 20-25 pip move from this level. Selling pressure on the pair will return today if Eurozone data is weak. Important! Before selling, ensure that the MACD indicator is below the zero mark and beginning to decline.
Scenario #2: I also plan to sell the euro today if there are two consecutive tests of the 1.0852 level when the MACD indicator is in the overbought zone. This will limit the pair's upward potential and lead to a downward market reversal. A decline toward the opposite levels of 1.0827 and 1.0792 can be expected.
What's on the Chart:
- The thin green line represents the entry price where the trading instrument can be bought.
- The thick green line indicates the expected price level where a Take Profit order can be placed, or profits can be manually secured, as further price growth above this level is unlikely.
- The thin red line represents the entry price where the trading instrument can be sold.
- The thick red line indicates the expected price level where a Take Profit order can be placed, or profits can be manually secured, as further price decline below this level is unlikely.
- The MACD indicator should be used to assess overbought and oversold zones when entering the market.
Important Notes:
- Beginner Forex traders should exercise extreme caution when making market entry decisions. It is advisable to stay out of the market before the release of important fundamental reports to avoid exposure to sharp price fluctuations. If you choose to trade during news releases, always use stop-loss orders to minimize potential losses. Trading without stop-loss orders can quickly wipe out your entire deposit, especially if you neglect money management principles and trade with high volumes.
- Remember, successful trading requires a well-defined trading plan, similar to the one outlined above. Making impulsive trading decisions based on the current market situation is a losing strategy for intraday traders.