On Tuesday, the EUR/USD pair once again showed little movement, which was expected. The only macroeconomic releases were two morning reports on economic expectations and sentiment in Germany and the Eurozone. From their titles alone, it was easy to predict that these reports would not trigger any market reactions, and in practice, they were largely ignored. No other significant events occurred throughout the day. As usual, representatives from the European Central Bank and the Federal Reserve delivered speeches, but these are currently of little relevance to traders, as the monetary easing paths of both central banks are well understood and largely priced into the market.
The second half of each month tends to be less eventful than the first, with fewer key reports being released. This week, four out of five trading days will lack significant market-moving data. While reports such as jobless claims and building permits are scheduled for release, their impact is generally minimal. Few traders can recall the last time these reports caused a notable market shift.
This week, the only significant day is Friday, when the PMI indices for the services and manufacturing sectors in Germany, the Eurozone, and the U.S. will be released. However, it's important to note that the U.S. data will not include the ISM indices, which are more influential in the market than the S&P indices. Therefore, the main focus will be on the European PMIs.
Expectations for these indices are relatively low. For example, the Eurozone manufacturing PMI has been below the critical 50.0 level for over two years. Even if there is some growth, it will still remain in contraction territory. The services PMI is in a slightly better position, but can we realistically expect this index alone to offset the weakness in the European economy and the ECB's dovish stance? Even if one of the reports from the Eurozone surprises us with a better-than-expected result, it is unlikely to alter the overall balance between the euro and the dollar.
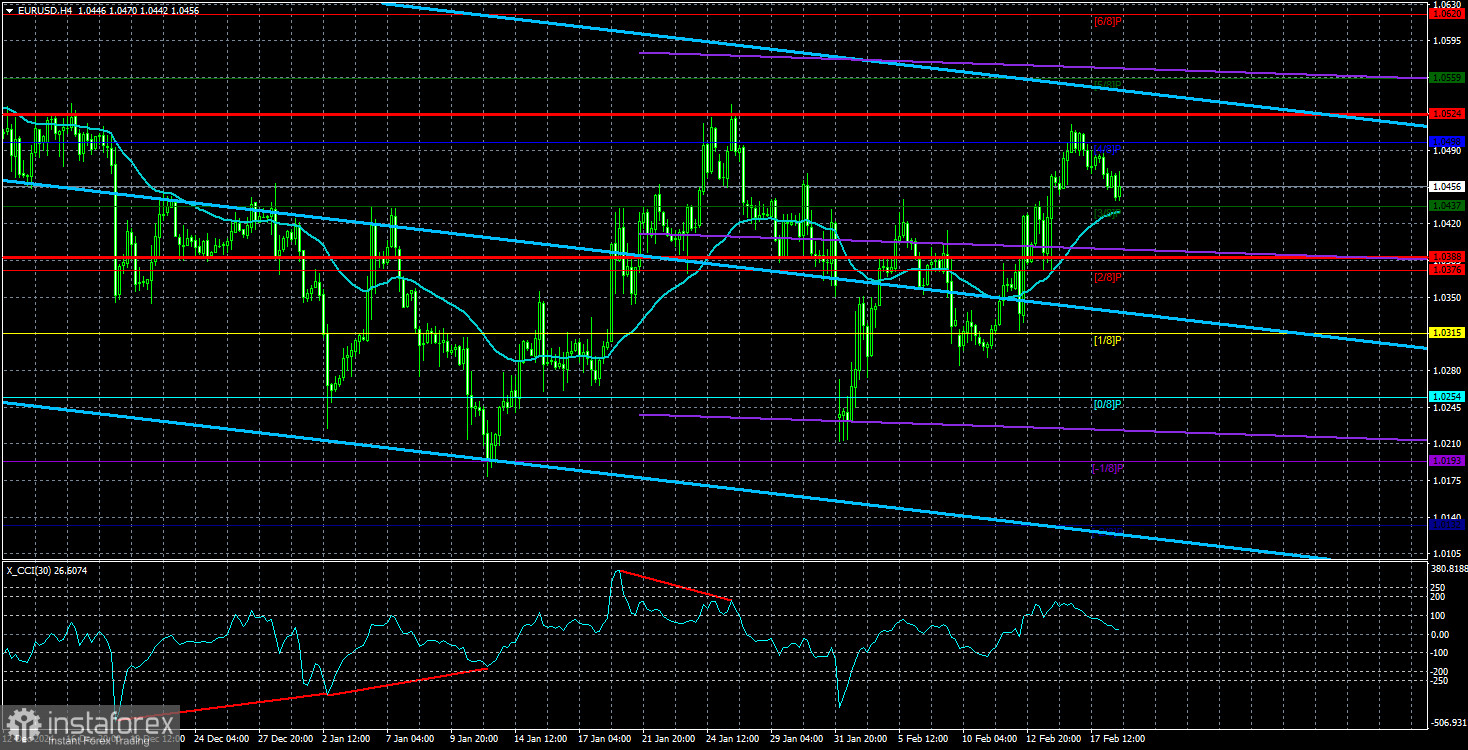
On the daily timeframe, the price has reached its previous high and stalled. This raises the likelihood that the euro is entering a prolonged flat movement. The price could drop back to $1.02 within this range before rebounding to $1.05. This type of movement has already been observed for about a month, reflecting the euro's lack of fundamental reasons for a stronger rally. Last week, the market bought the euro without clear justification, whereas a dollar rally would have been much more logical. However, the euro cannot continue rising indefinitely without a solid basis.
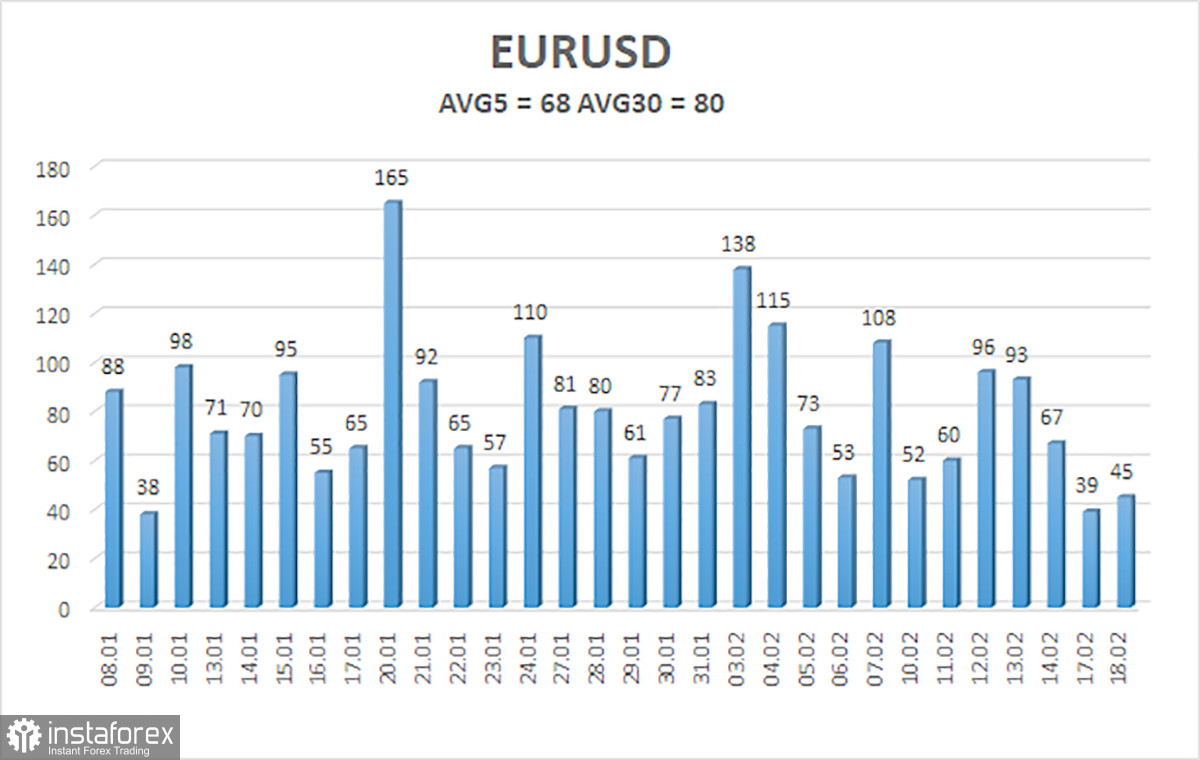
The average volatility of the EUR/USD pair over the last five trading days as of February 19 is 68 pips, which is considered "moderate." The expected range for Wednesday is between 1.0388 and 1.0524. The linear regression channel is still pointing downward, confirming the continuation of the global downtrend. The CCI indicator has entered the oversold area and is beginning a new upward correction.
Nearest Support Levels:
S1 – 1.0437
S2 – 1.0376
S3 – 1.0315
Nearest Resistance Levels:
R1 – 1.0498
R2 – 1.0559
R3 – 1.0620
Trading Recommendations:
The EUR/USD pair remains in a corrective uptrend. Over the past few months, our outlook has consistently favored a medium-term decline, and nothing has changed. The Fed has paused monetary easing, while the ECB is accelerating it. Aside from technical correction movements, the dollar still has no reasons for a medium-term decline, except for purely technical, corrective ones. Short positions remain the more attractive option, but technical correction may continue. For traders using "pure technical analysis," long positions can be considered if the price remains above the moving average, with targets at 1.0524 and 1.0559. Any further upward movement is still classified as a correction on the daily timeframe.
Explanation of Illustrations:
Linear Regression Channels help determine the current trend. If both channels are aligned, it indicates a strong trend.
Moving Average Line (settings: 20,0, smoothed) defines the short-term trend and guides the trading direction.
Murray Levels act as target levels for movements and corrections.
Volatility Levels (red lines) represent the likely price range for the pair over the next 24 hours based on current volatility readings.
CCI Indicator: If it enters the oversold region (below -250) or overbought region (above +250), it signals an impending trend reversal in the opposite direction.