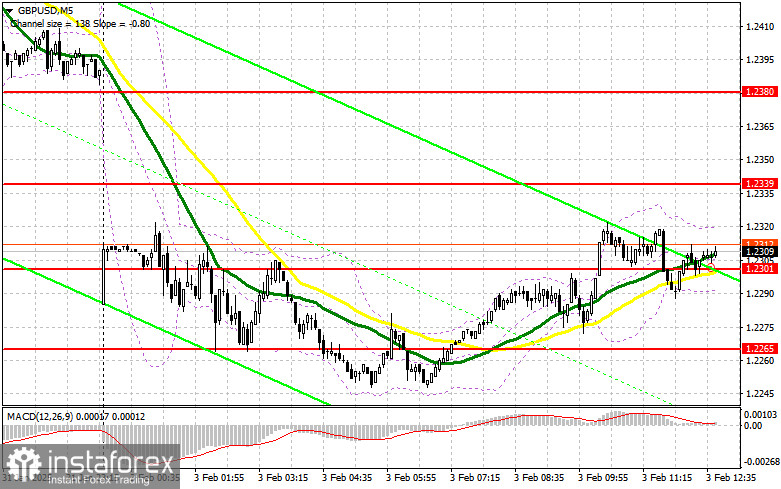
In my morning forecast, I highlighted the 1.2301 level as a key point for making market entry decisions. Let's review the 5-minute chart to see what happened. Although there was an upward movement, it did not reach a clear entry point. The technical outlook has been revised for the second half of the day.
To Open Long Positions on GBP/USD:
The final PMI data for the UK manufacturing sector matched preliminary figures, offering some support for the pound against the dollar. However, there's no strong advantage for buyers yet.
If the U.S. ISM Manufacturing Index data disappoints, it could pave the way for further GBP/USD corrections. Otherwise, pressure on the pair is likely to return quickly. In the event of a decline, as expected in the first half of the day, I will open long positions only after a false breakout around the new support at 1.2284, targeting a rise towards 1.2320—a level the pair failed to break in the morning session.
I expect sellers to re-emerge around 1.2320. A break and retest from above this level would create a new buying opportunity, aiming to test 1.2351, which would result in a solid correction for the pair. The final target for long positions will be the 1.2389 level, where I plan to take profit.
If GBP/USD falls further and there is no bullish activity around 1.2284, the pressure on the pound will increase. In this case, a false breakout around the 1.2248 low will be a suitable condition to open long positions. I plan to buy GBP/USD immediately on a rebound from 1.2204, aiming for a 30–35 point correction within the day.
To Open Short Positions on GBP/USD:
Pound sellers could return to the market at any moment, needing only a catalyst. A potential trigger could be the speech by FOMC member Raphael Bostic. If there's another attempt at growth, I will act from the nearest resistance at 1.2320. A false breakout there, combined with strong U.S. data, will create an entry point for short positions, aiming for a decline to 1.2284. A break and retest from below this level will trigger stop-loss orders, opening the way to 1.2248. The final target will be 1.2204, where I will take profit.
If demand for the pound persists in the second half of the day and bears fail to show around 1.2320, the pair could recover significantly. In this case, I will delay short positions until testing resistance at 1.2351, where moving averages—favoring sellers—are also located. I will open short positions at 1.2351 only after a false breakout. If there's no downward movement even at this level, I will look for short positions on a rebound from 1.2389, targeting a 30–35 point correction within the day.
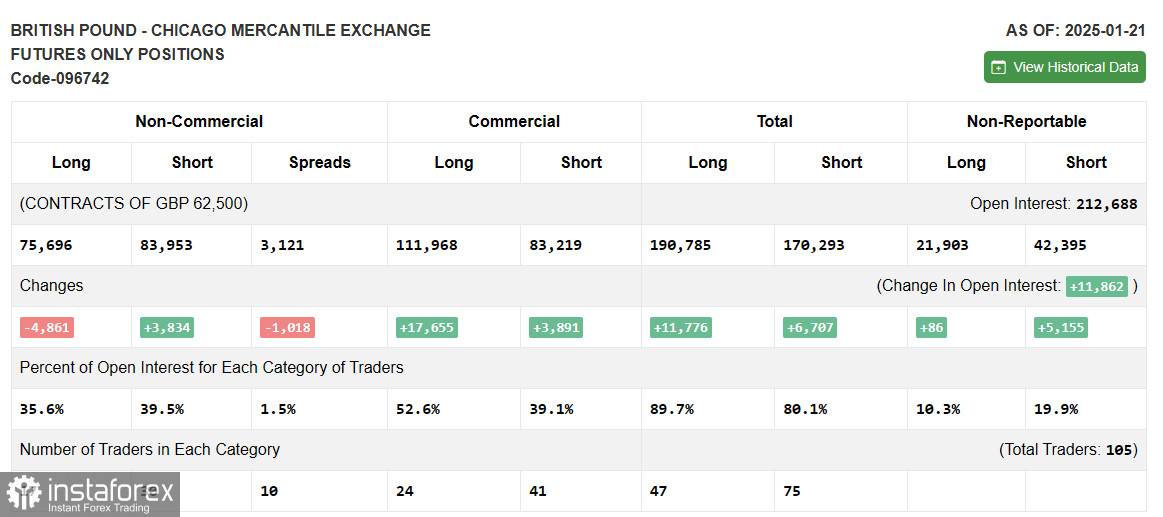
The COT (Commitment of Traders) report for January 21 showed an increase in short positions and a decline in long positions. The balance of power continues to shift towards sellers, which is not surprising. Recent UK economic data has been disappointing, while inflation is rising, putting the Bank of England in a difficult position. The regulator is likely to cut interest rates again at the next committee meeting, and this is already being priced into the pound.
However, short-term movements will depend on the decisions of the new Trump administration, so don't forget the strength of the U.S. dollar. The latest COT report indicates that non-commercial long positions decreased by 4,861 to 75,696, while non-commercial short positions increased by 3,834 to 83,953. As a result, the gap between long and short positions narrowed by 1,018.
Indicator Signals
Moving Averages
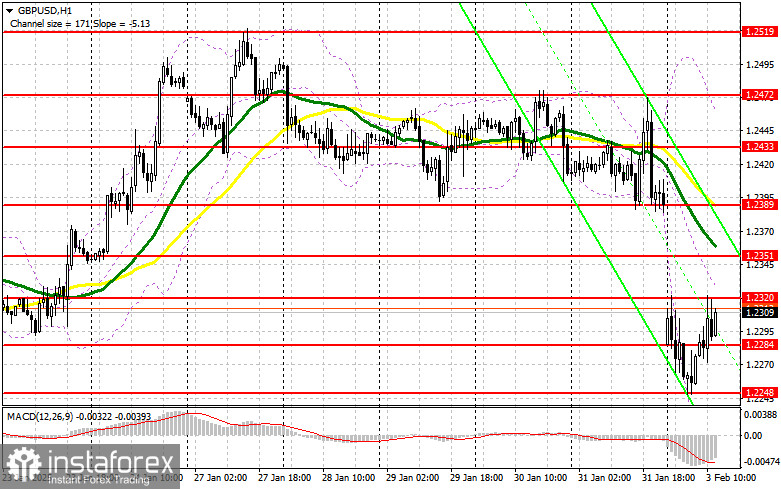
Trading is below the 30- and 50-day moving averages, indicating a continued decline for the pair.
Note: The period and prices of the moving averages are based on the H1 chart and differ from the classic daily moving averages on the D1 chart.
Bollinger Bands:
In case of a decline, the lower Bollinger Band near 1.2204 will act as support.
Indicator Descriptions:
- Moving Average (MA): Determines the current trend by smoothing out volatility and noise.
- 50-period MA is marked in yellow on the chart.
- 30-period MA is marked in green on the chart.
- MACD (Moving Average Convergence/Divergence):
- Fast EMA – 12-period
- Slow EMA – 26-period
- SMA – 9-period
- Bollinger Bands: Measures market volatility.
- Non-commercial traders: Speculators such as individual traders, hedge funds, and large institutions using the futures market for speculative purposes.
- Long non-commercial positions: Total long open positions held by non-commercial traders.
- Short non-commercial positions: Total short open positions held by non-commercial traders.
- Net non-commercial position: The difference between short and long positions held by non-commercial traders.