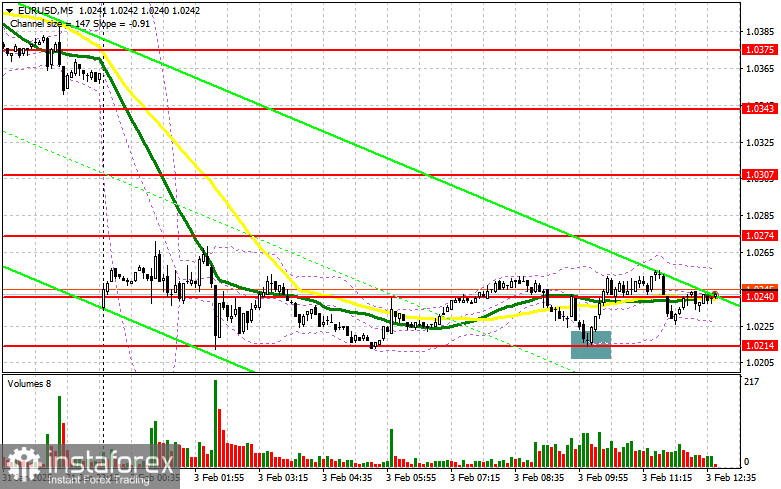
In my morning forecast, I highlighted the 1.0214 level as a key decision point for market entries. Let's take a look at the 5-minute chart to see what happened. A decline followed by a false breakout near 1.0214 provided an excellent entry point for buying the euro, resulting in a gain of over 30 points. The technical outlook was revised for the second half of the day.
To Open Long Positions on EUR/USD:
Strong manufacturing data from the Eurozone for January supported the euro, preventing the pair from breaking the key support level at 1.0214. Now, all attention shifts to similar data from the U.S.—specifically the ISM Manufacturing Index for January.
If the ISM reading exceeds 50 points, pressure on the euro may intensify, and the dollar could regain momentum. The speech by FOMC member Raphael Bostic also warrants close attention.
Considering the bearish market, only a false breakout around the new support at 1.0216 will provide a solid buying opportunity, similar to the scenario described above. The target for growth will be resistance at 1.0254, formed during the first half of the day. A break and retest of this range would confirm the buying entry, pushing the pair toward 1.0283. The final target will be the 1.0313 high, where I plan to take profit.
If EUR/USD declines further and shows no activity near 1.0216—a level that has been tested several times—the pair risks falling even lower, reinforcing the new bearish trend. In this case, sellers could push the price down to 1.0182. Only after a false breakout at 1.0182 would I consider buying the euro. I plan to open long positions immediately on a rebound from 1.0132, aiming for an intraday correction of 30–35 points.
To Open Short Positions on EUR/USD:
Sellers tried but have not yet achieved significant results. If U.S. data turns out weak, focus will shift to defending the major resistance at 1.0254. A false breakout at 1.0254 will confirm the presence of large sellers in the market, providing an entry point for short positions with a target of 1.0216. A break and consolidation below 1.0216, followed by a retest from below, will offer another selling opportunity, pushing the pair toward the new monthly low at 1.0182. The final target for sellers will be 1.0132, where I will take profit.
If EUR/USD moves up in the second half of the day and bears show no activity around 1.0254, bulls will have a good chance for a correction. In this case, I will delay short positions until testing the next resistance at 1.0283. I will consider selling from 1.0283 only after a failed consolidation. I plan to open short positions immediately on a rebound from 1.0313, aiming for a 30–35 point downward correction.
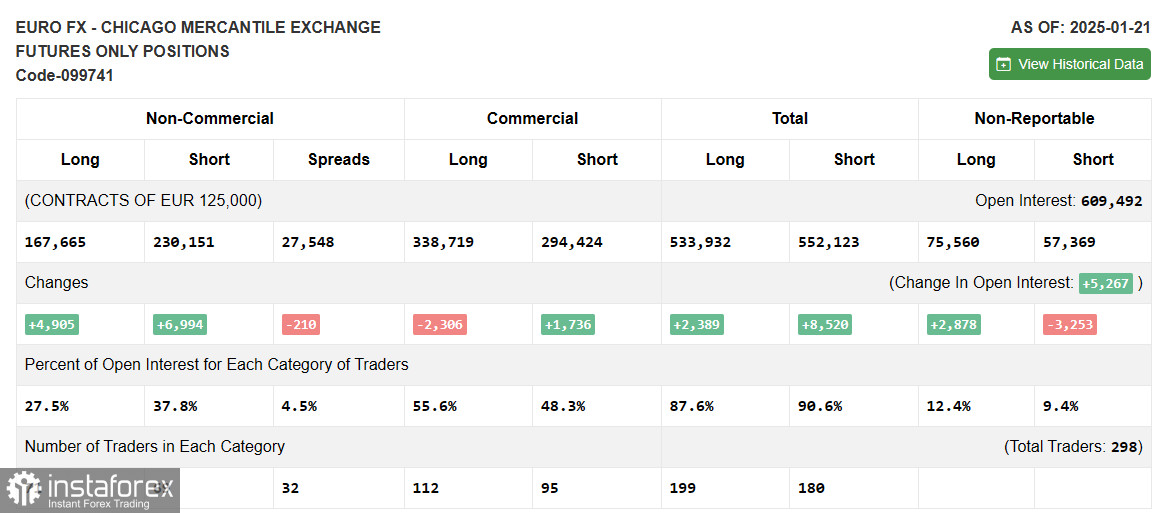
In the COT (Commitment of Traders) report for January 21, both long and short positions increased, but the overall market sentiment remained unchanged. Traders still favor selling and short positions on the euro, as it's expected that Trump will eventually move from words to action, leading to a significant dollar rally against the euro. The future of the Federal Reserve's policy remains uncertain. We will learn the results of the FOMC meeting soon, which could further strengthen the dollar.
The COT report shows that non-commercial long positions increased by 4,905 to 167,665, while non-commercial short positions jumped by 6,994 to 230,151. As a result, the gap between long and short positions narrowed by 210.
Indicator Signals
Moving Averages
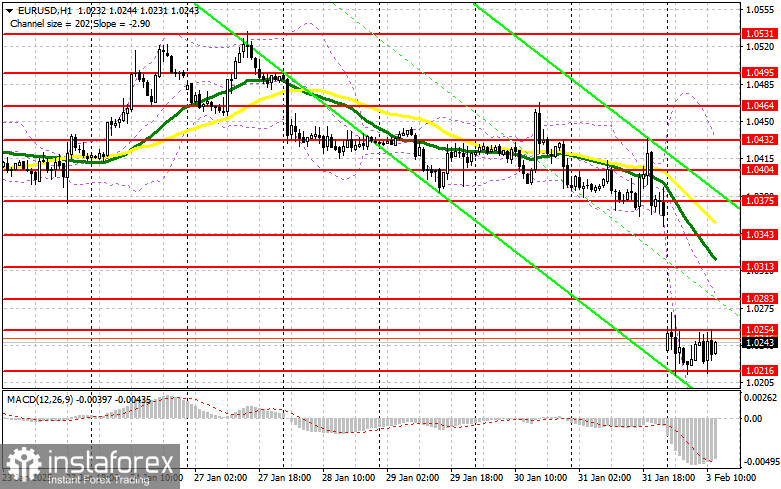
Trading is below the 30- and 50-day moving averages, maintaining pressure on the euro.
Note: The period and prices for moving averages are based on the H1 chart and differ from the classical daily moving averages on the D1 chart.
Bollinger Bands:
In case of a decline, the lower Bollinger Band around 1.0140 will act as support.
Indicator Descriptions:
- Moving Average (MA): Identifies the current trend by smoothing out volatility and noise.
- 50-period MA is marked in yellow on the chart.
- 30-period MA is marked in green on the chart.
- MACD (Moving Average Convergence/Divergence):
- Fast EMA – 12-period
- Slow EMA – 26-period
- SMA – 9-period
- Bollinger Bands: Measures market volatility.
- Non-commercial traders: Speculators like individual traders, hedge funds, and large institutions using the futures market for speculative purposes.
- Long non-commercial positions: Total long open positions held by non-commercial traders.
- Short non-commercial positions: Total short open positions held by non-commercial traders.
- Net non-commercial position: The difference between short and long positions held by non-commercial traders.