empty
22.11.2024 05:31 PM
GBP/USD: November 22 - Another Decline for the Pound

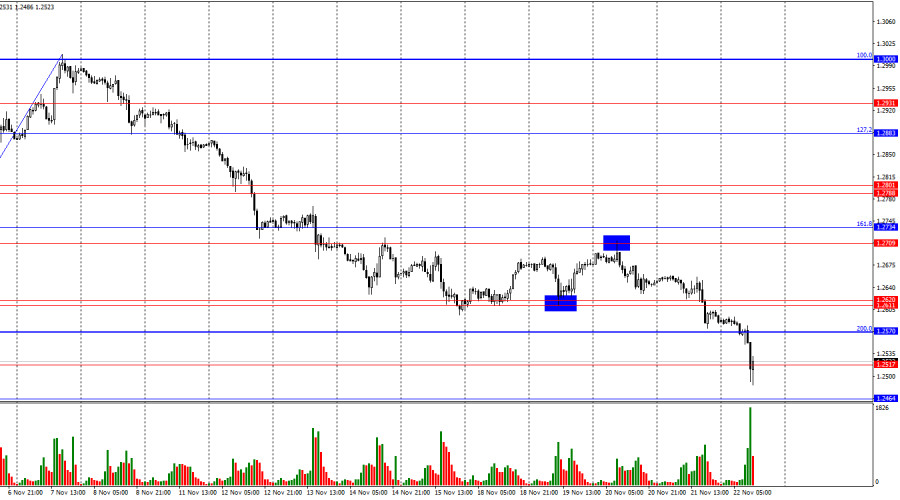
On the hourly chart, the GBP/USD pair continued its downward movement on Thursday and extended its decline into Friday. Today, the pair has reached the 1.2517 level, where the decline may temporarily pause. Bearish traders are aggressively selling the pound, disregarding the significance of incoming data. A rebound from the 1.2517 level could signal the start of a long-awaited correction.

This image is no longer relevant

The wave pattern is clear. The most recent completed upward wave failed to break the peak of the previous wave, while the ongoing downward wave has already broken two prior lows. This confirms the continuation of the bearish trend. For signs of a reversal, the pair must return to the 1.2710 level and close above the last peak.

On Thursday, there was little in the way of market-moving information for the pound, but this did not hinder the bears. They continued to sell the British currency. The sell-off intensified this morning when the UK released disappointing reports on business activity and retail sales. Retail trade volumes in October fell by 0.7%, worse than the forecasted -0.3%. The services PMI dropped from 52 to 50, and the manufacturing PMI declined from 49.9 to 48.6. These figures further accelerated the pound's downward momentum.

The US reports have yet to be released, but the pound has already fallen by 90 points. The decline may continue into the afternoon when three key US economic reports are scheduled for release. Similar data earlier today drove nearly a 100-point move, so further volatility is expected. In my view, the pound's decline is entirely justified. As I've noted in the "Commitments of Traders" section before, the pound's value should be lower than it was a month or two ago.

This image is no longer relevant

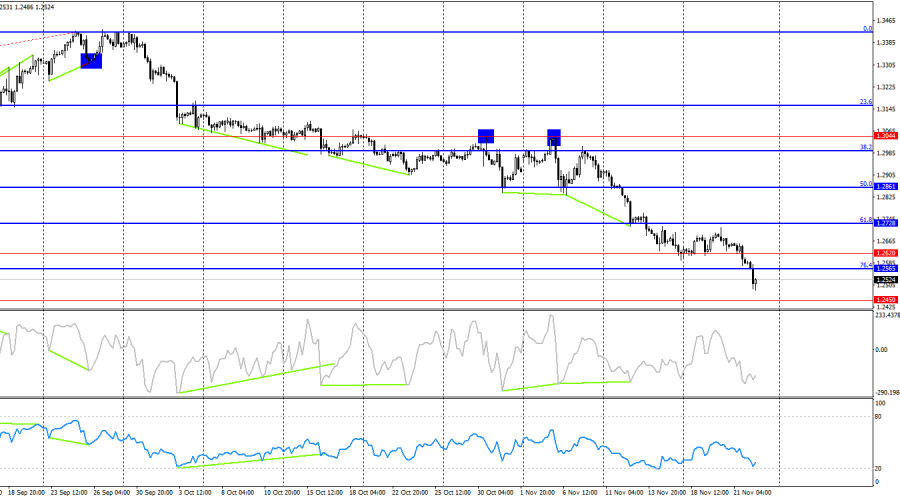
On the 4-hour chart, the pair successfully broke below the 1.2620 and 1.2565 levels, paving the way for a further decline toward the next support at 1.2450. At this time, there are no signs of a bearish retreat. Regularly forming bullish divergences appear to have little impact on traders in the current environment.

Commitments of Traders (COT) Report:

This image is no longer relevant

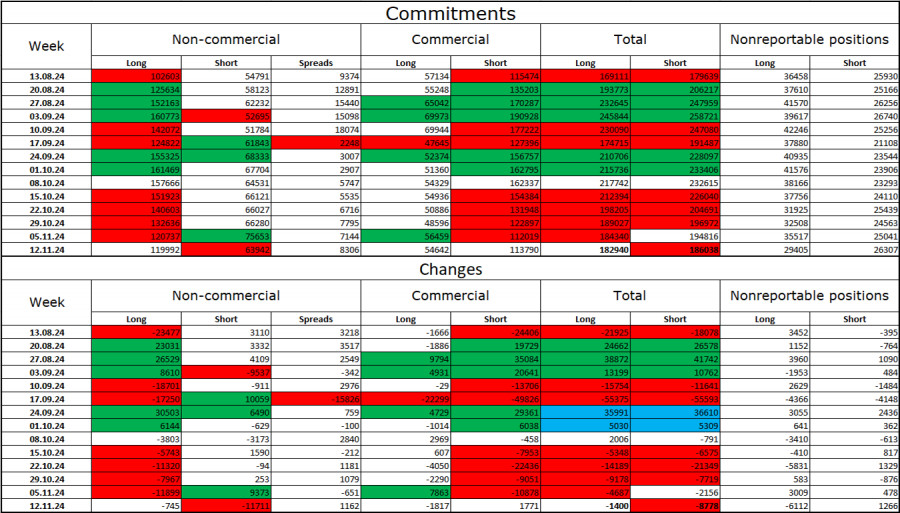
The sentiment among "Non-commercial" traders became more bullish during the latest reporting week. The number of long positions held by speculators decreased by 745, while the number of short positions fell by 11,711. Despite these changes, bulls still maintain a significant advantage, with the gap between long and short positions standing at 56,000: 120,000 longs versus 64,000 shorts.

In my opinion, the outlook for the pound remains bearish, and the COT reports suggest a strengthening of bearish positions. Over the past three months, the number of Long positions has increased from 102,000 to 120,000, while the number of shorts has risen from 55,000 to 64,000. Professional traders are likely to continue liquidating Long positions or increasing Short positions, as most supportive factors for the pound have already been priced in. Technical analysis also supports further downward potential for the pound.

US and UK Economic Calendars:

  • UK: Manufacturing PMI (09:30 UTC)
  • UK: Services PMI (09:30 UTC)
  • US: Manufacturing PMI (14:45 UTC)
  • US: Services PMI (14:45 UTC)
  • US: University of Michigan Consumer Sentiment Index (15:00 UTC)

Friday's economic calendar includes six key events, three of which have already triggered a significant decline in the pound. The information flow may continue to influence trader sentiment moderately for the rest of the day.

GBP/USD Trading Tips:

Sales of the pair were possible following a rebound from the 1.3044 level on the 4-hour chart, targeting 1.2931. This target was hit twice. Subsequent targets at 1.2931, 1.2892, 1.2788–1.2801, 1.2752, and 1.2611–1.2620 were also reached. Closing below the 1.2611–1.2620 zone allowed for further sales targeting 1.2570 and 1.2517, which have also been achieved.

At this time, I do not recommend buying the pair in a bearish trend. The downward movement shows no signs of ending.

Fibonacci Levels:

The Fibonacci grids are drawn from 1.3000 to 1.3432 on the hourly chart and from 1.2299 to 1.3432 on the 4-hour chart.

Samir Klishi,
Analytical expert of InstaForex
© 2007-2025
Select timeframe
5
min
15
min
30
min
1
hour
4
hours
1
day
1
week
Earn on cryptocurrency rate changes with InstaForex
Download MetaTrader 4 and open your first trade
  • Grand Choice
    Contest by
    InstaForex
    InstaForex always strives to help you
    fulfill your biggest dreams.
    JOIN CONTEST

Recommended Stories

Trading Signals for EUR/USD for April 30, 2025: sell below 1.1376 (21 SMA - 7/8 Murray)

Early in the American session, the EUR/USD pair is trading around 1.1378 within the downtrend channel formed on April 17 and showing signs of exhaustion of bullish strength. A technical

Dimitrios Zappas 17:37 2025-04-30 UTC+2

Forex forecast 30/04/2025: EUR/USD, AUD/USD, USD/JPY, Gold, and Bitcoin

Useful links: My other articles are available in this section InstaForex course for beginners Popular Analytics Open trading account Important: The begginers in forex trading need to be very careful

Sebastian Seliga 16:31 2025-04-30 UTC+2

Trading Signals for GOLD (XAU/USD) for April 30, 2025: buy above $3,270 (21 SMA - 6/8 Murray)

Early in the American session, gold is trading around 3,384, above key support and rebounding after reaching 3,267. Gold is expected to regain strength if it consolidates above 3,381 (6/8

Dimitrios Zappas 15:07 2025-04-30 UTC+2

Forex forecast 29/04/2025: EUR/USD, GBP/USD, Gold, Ethereum and Bitcoin

Useful links: My other articles are available in this section InstaForex course for beginners Popular Analytics Open trading account Important: The begginers in forex trading need to be very careful

Sebastian Seliga 08:41 2025-04-30 UTC+2

Technical Analysis of Intraday Price Movement of AUD/JPY Cross Currency Pairs, Wednesday April 30, 2025.

With the appearance of Divergent and Descending Broadening Wedge patterns on the 4-hour chart of the AUD/JPY cross currency pair, although its price movement is below the EMA (21) which

Arief Makmur 06:19 2025-04-30 UTC+2

Technical Analysis of Intraday Price Movement of USD/JPY Main Currency Pairs, Wednesday April 30, 2025.

On the 4-hour chart of the main currency pair USD/JPY, it can be seen that the Stochastic Oscillator indicator forms a Double Bottom pattern while the price movement of USD/JPY

Arief Makmur 06:17 2025-04-30 UTC+2

Trading Signals for GOLD (XAU/USD) for April 29-30, 2025: buy above $3,310 (21 SMA - 7/8 Murray)

Early in the American session, gold is trading around the 3,310 level, where it is located at the 21SMA and within a symmetrical triangle pattern formed on April 23. Consolidation

Dimitrios Zappas 18:10 2025-04-29 UTC+2

Trading Signals for EUR/USD for April 29-30, 2025: sell below 1.1410 (symmetrical triangle - 7/8 Murray)

Our trading plan for the coming hours is to sell below 1.1410 with targets at 1.1370 and 1.1230. The eagle indicator is giving a negative signal, so we believe

Dimitrios Zappas 17:52 2025-04-29 UTC+2

Forex forecast 28/04/2025: EUR/USD, GBP/USD, USD/JPY, USDX, Gold and Bitcoin

Useful links: My other articles are available in this section InstaForex course for beginners Popular Analytics Open trading account Important: The begginers in forex trading need to be very careful

Sebastian Seliga 18:34 2025-04-28 UTC+2

Trading Signals for EUR/USD for April 28-30, 2025: sell below 1.1370 (21 SMA - 7/8 Murray)

On the other hand, if bearish pressure prevails and the euro consolidates below 1.1370, it could be seen as a sell signal with targets at the 6/8 Murray located

Dimitrios Zappas 16:29 2025-04-28 UTC+2
Can't speak right now?
Ask your question in the chat.
Widget callback
 

Dear visitor,

Your IP address shows that you are currently located in the USA. If you are a resident of the United States, you are prohibited from using the services of InstaFintech Group including online trading, online transfers, deposit/withdrawal of funds, etc.

If you think you are seeing this message by mistake and your location is not the US, kindly proceed to the website. Otherwise, you must leave the website in order to comply with government restrictions.

Why does your IP address show your location as the USA?

  • - you are using a VPN provided by a hosting company based in the United States;
  • - your IP does not have proper WHOIS records;
  • - an error occurred in the WHOIS geolocation database.

Please confirm whether you are a US resident or not by clicking the relevant button below. If you choose the wrong option, being a US resident, you will not be able to open an account with InstaForex anyway.

We are sorry for any inconvenience caused by this message.