GBP/USD 5-Minute Analysis
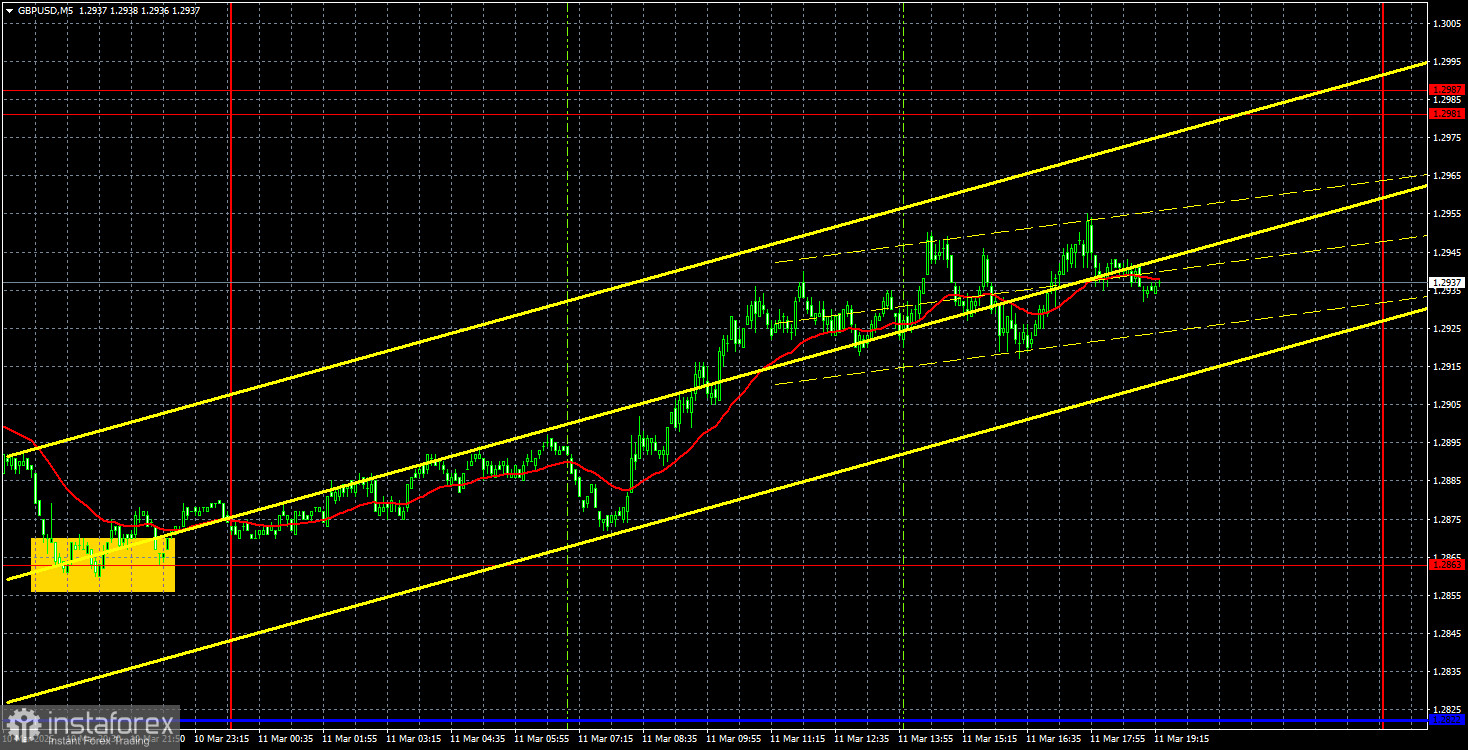
The GBP/USD currency pair has resumed its upward movement. Over the past two or three trading days, the price appeared to be on the verge of a slight pullback but failed to consolidate below the key level of 1.2863. Consequently, growth resumed on Tuesday, driven not only by President Trump's new tariffs but also by broader market dynamics.
The U.S. president doubled tariffs on Canadian steel and aluminum; however, the situation has evolved beyond just tariffs or a trade war. An open conflict has arisen between Canada and the U.S., with an uncertain outcome. Under Mark Carney's leadership, Canada responded aggressively to Trump's actions, imposing retaliatory tariffs on significant amounts, cutting electricity supplies to certain U.S. states, and boycotting American goods. Additionally, Trump expressed his frustration that Canada refused to become the 51st U.S. state.
As a result, market participants have continued to move away from the risky and conflict-ridden U.S. dollar, which is increasingly unwanted. Despite a 16-year downward trajectory, the current environment suggests that the dollar could continue to decline for an extended period.
The only trading signal from yesterday originated on Monday evening when the price bounced off 1.2863. Throughout Tuesday, the price continued to rise, nearly gaining another 100 points for the British pound.
COT Report
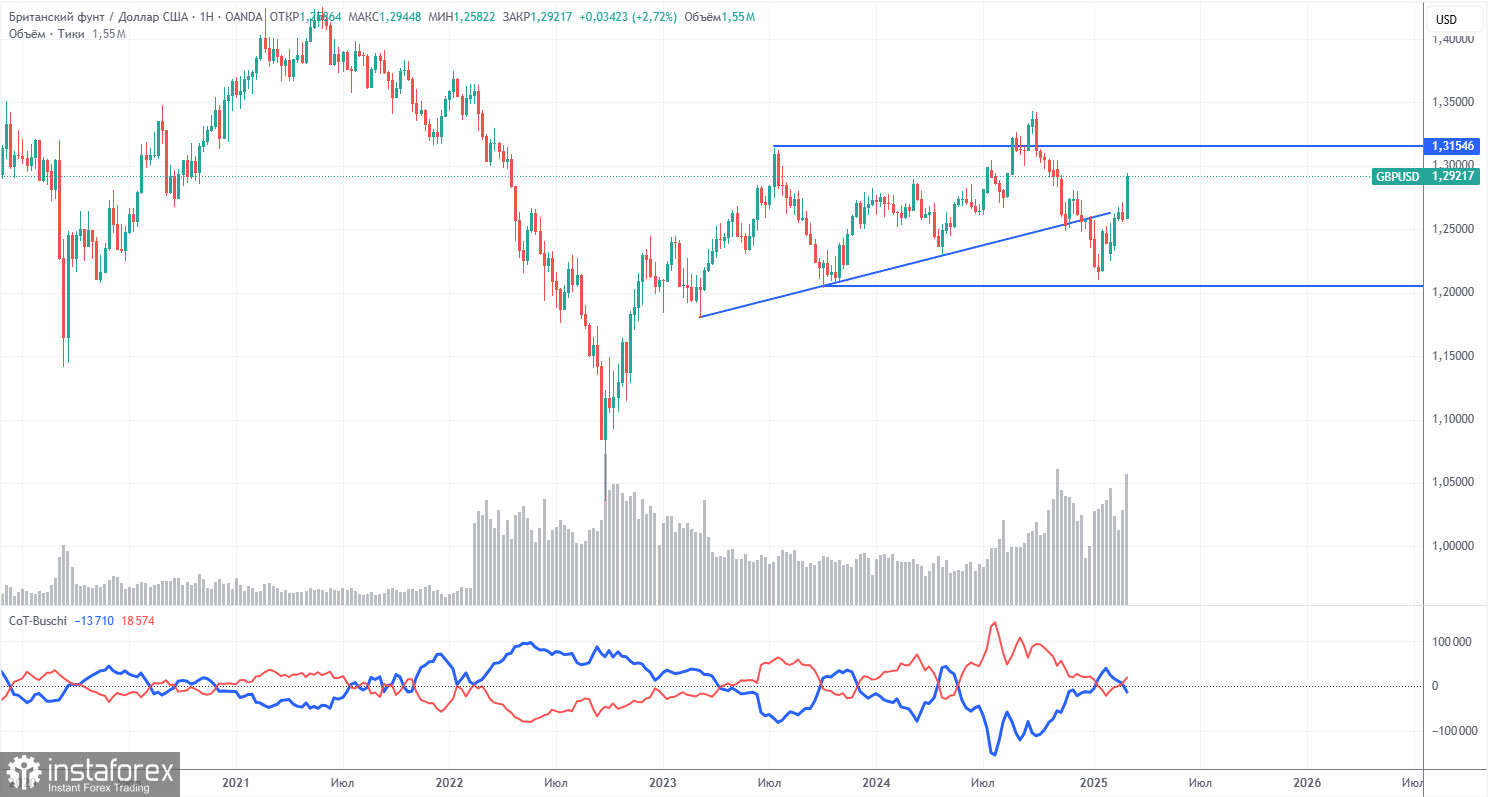
COT reports for the British pound indicate that the sentiment among commercial traders has been fluctuating in recent years. The red and blue lines, representing the net positions of commercial and non-commercial traders, frequently intersect and typically hover around the zero line. Currently, these lines are close to each other, indicating a roughly equal number of buy and sell positions.
On the weekly timeframe, the price initially broke the 1.3154 level before dropping to the trend line, which it subsequently broke through. This break suggests that the pound's decline is likely to continue. However, there was also a bounce from the second-to-last local low on the weekly chart, which could imply a flat market.
According to the latest COT report on the British pound, the "Non-commercial" group opened 7,800 buy contracts and closed 6,300 sell contracts. Consequently, the net position of non-commercial traders increased by 14,100 contracts over the week, which does not significantly favor the pound.
The fundamental backdrop still offers no solid reasons for long-term investments in the British pound, and the currency faces a real possibility of continuing its global downtrend. Although the pound has recently experienced a notable increase, the underlying cause appears to be related to Donald Trump's policies.
GBP/USD 1-Hour Analysis
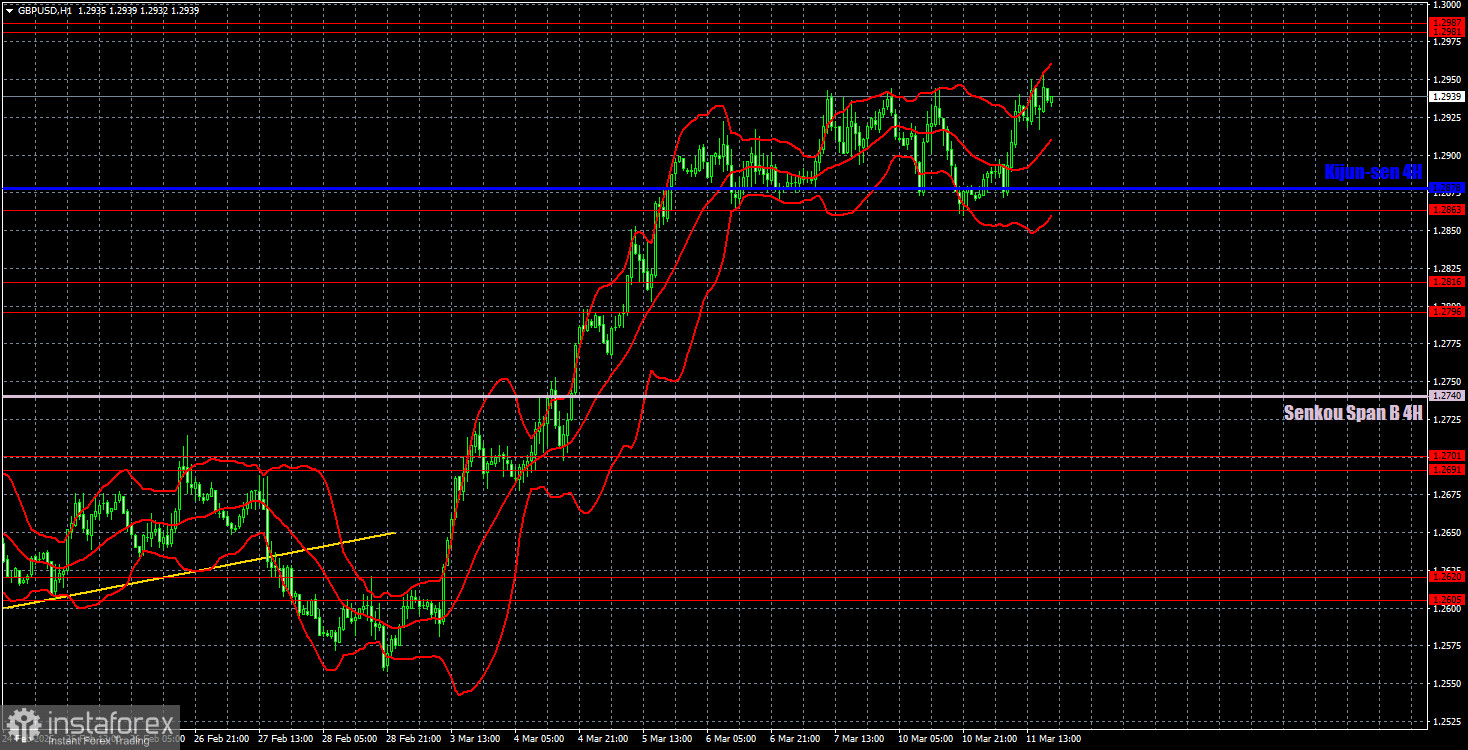
In the hourly time frame, GBP/USD continues its uptrend, which looks more like a dollar collapse than true sterling strength. This decline may not be the last in a series of trend reversals within the broader uptrend seen on the daily chart. However, this correction is already overdue for completion. We still don't see any fundamental reasons for the British pound to rally long-term. Trump is the only factor driving the sterling higher right now, as he continues to impose sanctions and tariffs indiscriminately. The market is ignoring all other factors. Once those factors start to matter, the dollar could strengthen again.
For March 12, we highlight the following key levels: 1.2237-1.2255, 1.2331-1.2349, 1.2429-1.2445, 1.2511, 1.2605-1.2620, 1.2691-1.2701, 1.2796-1.2816, 1.2863, 1.2981-1.2987, and 1.3050. The Senkou Span B line (1.2740) and the Kijun-sen line (1.2878) may also serve as trading signal sources. A Stop Loss order is recommended at breakeven when the price moves 20 points in the right direction. Ichimoku indicator lines may shift throughout the day, so this should be considered when determining trading signals.
On Wednesday, the UK economic calendar contains no significant events, while the U.S. will release its Consumer Price Index (CPI). This report is crucial for the Fed's monetary policy outlook, but at this point, Fed policy is meaningless to the market and has no impact on the dollar. The U.S. currency continues to fall solely due to Donald Trump's actions.
Illustration Explanations:
- Support and Resistance Levels (thick red lines): Thick red lines indicate where movement may come to an end. Please note that these lines are not sources of trading signals.
- Kijun-sen and Senkou Span B Lines: Ichimoku indicator lines transferred from the 4-hour timeframe to the hourly timeframe. These are strong lines.
- Extreme Levels (thin red lines): Thin red lines where the price has previously bounced. These serve as sources of trading signals.
- Yellow Lines: Trendlines, trend channels, or any other technical patterns.
- Indicator 1 on COT Charts: Represents the net position size for each category of traders.