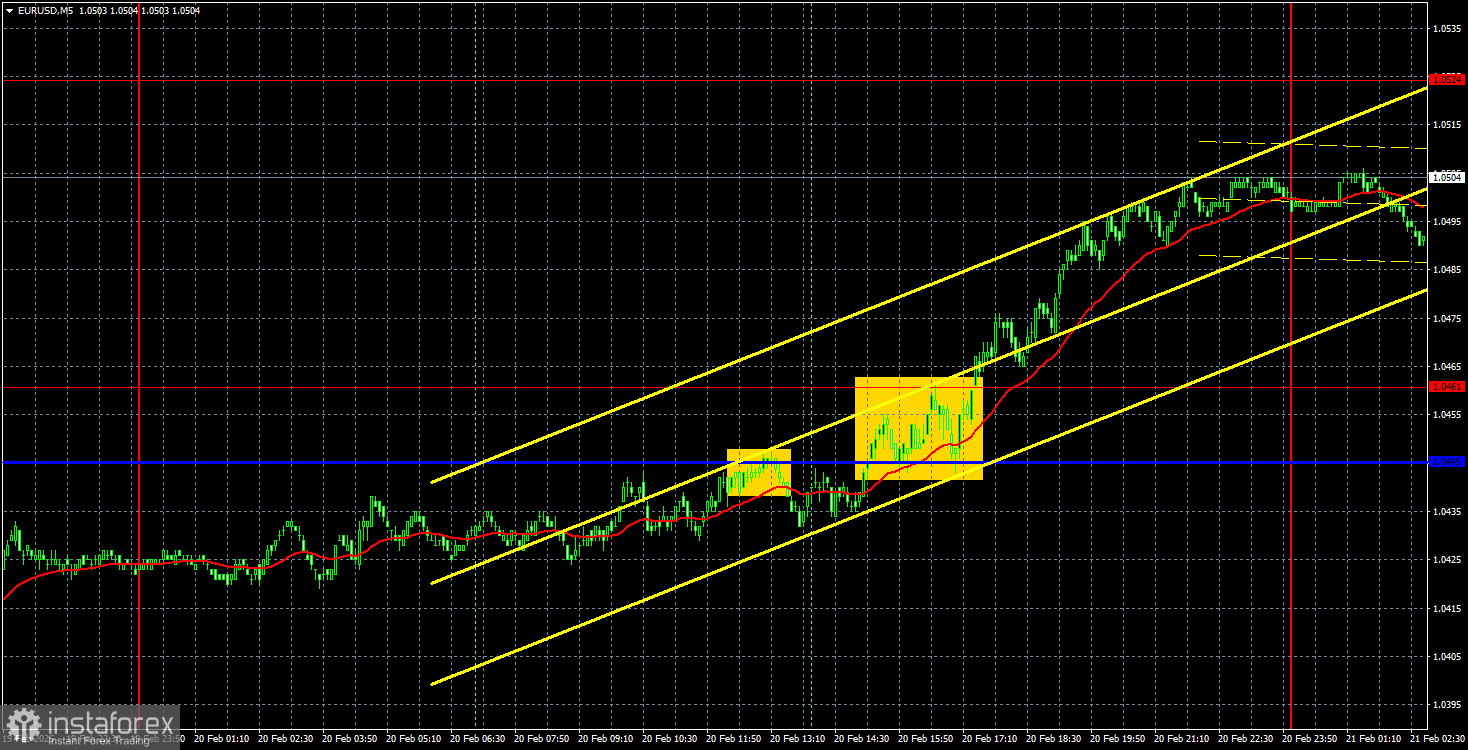
EUR/USD 5-Minute Analysis
On Thursday, the EUR/USD currency pair resumed its upward movement, rebounding for the fifth or sixth time from the trendline. We did not expect the price to fail again in breaking through this level, but since it did not consolidate below it, the short-term uptrend remains intact. This meant that buying the euro was once again a viable option.
Looking at the hourly timeframe, it may seem that the euro has been rising strongly for an extended period. However, shifting to the daily timeframe, it becomes evident that the price has been trading in a sideways range for almost a month and is currently near the upper boundary of this range. Therefore, a reversal to the downside could occur soon, potentially leading to a 200-250 pip drop.
The key question is: Why has the euro been rising for the past two weeks? What is driving this growth? There were no significant macroeconomic or fundamental events in the Eurozone or the U.S. yesterday, and Donald Trump did not introduce new tariffs or sanctions. Last week, the euro had more reasons to decline than rise, as macroeconomic data continue to disappoint euro bulls. As a result, this current growth appears to be a purely technical correction.
Regarding trading signals on the 5-minute chart, we saw a rebound from the critical line and a breakthrough of the 1.0445–1.0461 zone. The first sell signal turned out to be false, leading to a loss. However, the second buy signal was better, but volatility has remained very low in recent days. Even if traders had closed their long positions overnight, they could have gained only 25–30 pips at most.
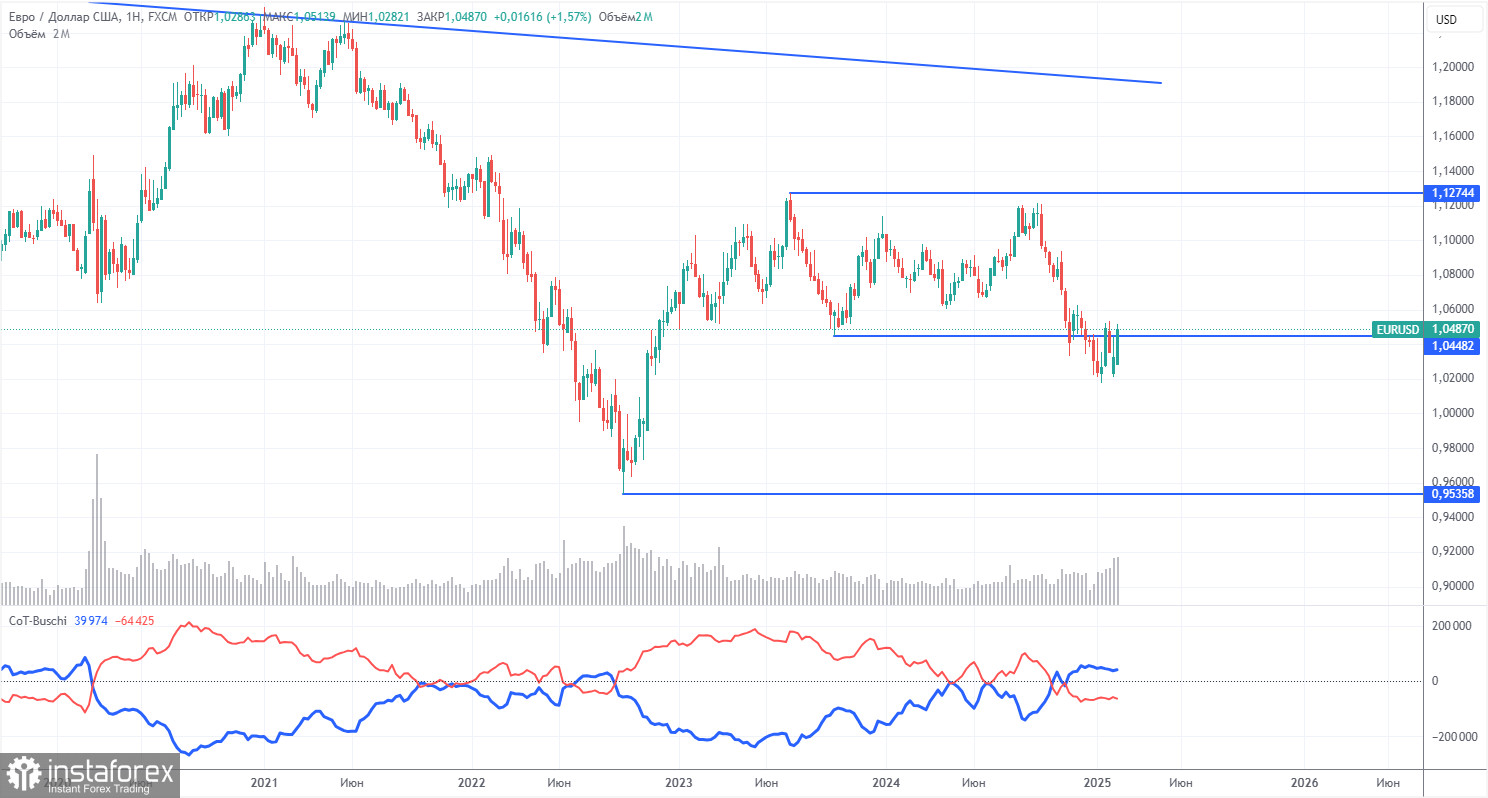
COT Report
The latest Commitments of Traders (COT) report, dated February 11, reveals that non-commercial traders have maintained a bullish net position for an extended period. However, bears have now taken control. Three months ago, there was a significant increase in short positions among professional traders, resulting in a negative net position for the first time in a long while. This shift indicates that the euro is now being sold more frequently than it is being bought.
Currently, there are no fundamental factors supporting the strength of the euro. The recent upward movement on the weekly timeframe is barely noticeable, suggesting it is merely a technical pullback. The long-standing 16-year downward trend remains intact, even if the pair continues to experience corrections for a few more weeks.
At present, the red and blue lines in the COT report have crossed, indicating a change in their relative positions and signaling a bearish trend in the market. During the last reporting week, long positions among non-commercial traders increased by 3,000, while short positions rose by 8,800, leading to a net position decrease of 5,800.
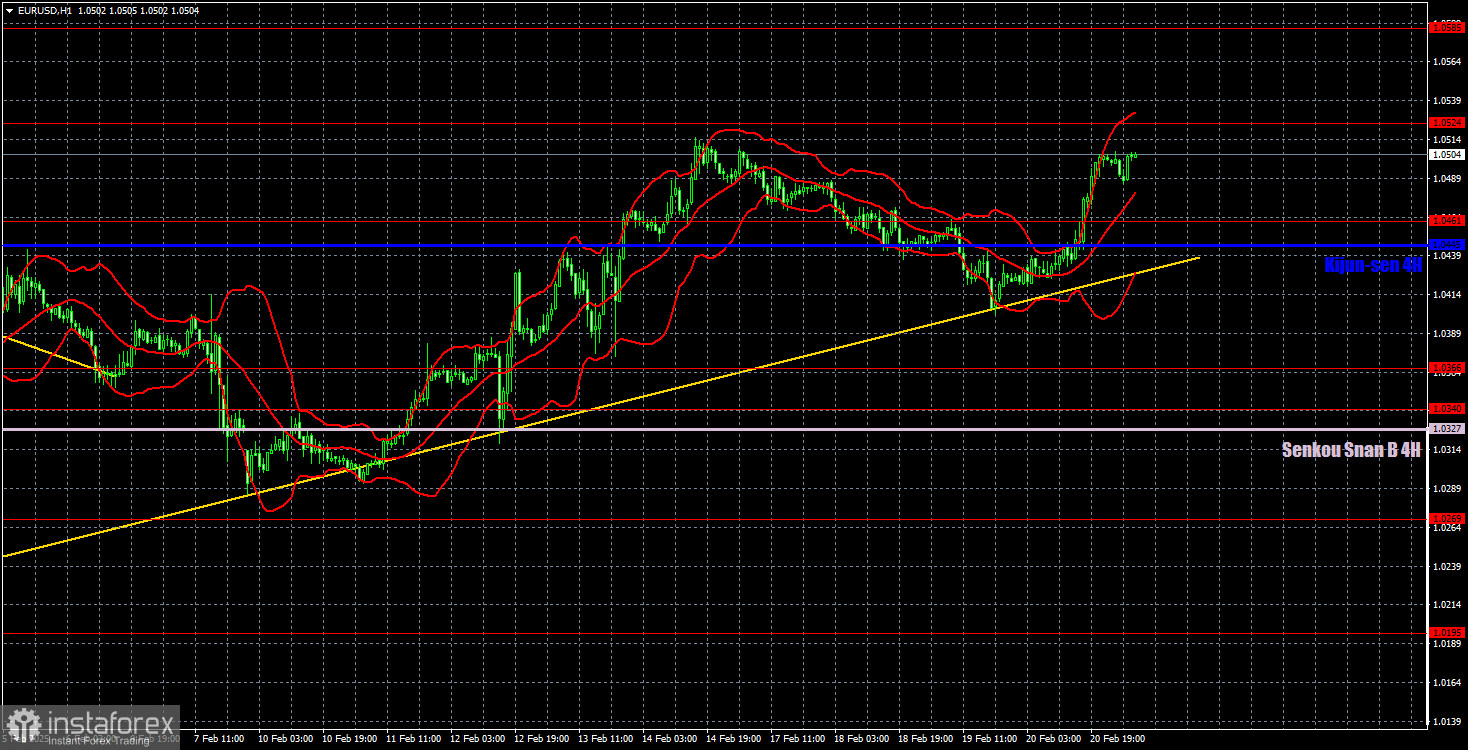
EUR/USD 1-Hour Analysis
On the hourly timeframe, the currency pair is currently in a local uptrend. However, we anticipate that a medium-term decline will resume. This expectation is based on the likelihood that the Federal Reserve will only cut interest rates 1-2 times in 2025, while the European Central Bank may implement more aggressive rate cuts. In the short term, we may experience another one or two upward trends. This is possible because a correction on the daily timeframe could take a considerable amount of time and be quite complex. Nevertheless, the euro currently lacks strong fundamental reasons to rise, and approximately 80% of its upward movement appears to be driven by technical factors.
For trading on February 21, we highlight the following key levels: 1.0124, 1.0195, 1.0269, 1.0340-1.0366, 1.0461, 1.0524, 1.0585, 1.0658-1.0669, 1.0757, 1.0797, and 1.0843. We also note the Senkou Span B at 1.0327 and the Kijun-sen at 1.0445. Keep in mind that the lines of the Ichimoku indicator can move during the day, which should be factored into your trading decisions. It is also advisable to place a Stop Loss order at breakeven if the price moves in your favor by 15 pips. This strategy will help protect you from potential losses if the signal turns out to be invalid.
On Friday, several economic reports are scheduled for release in the Eurozone, Germany, and the United States. These include the PMI indexes for the services and manufacturing sectors and the University of Michigan Consumer Sentiment Index in the U.S. While these reports are not classified as high-impact, the volume of data releases could make Friday one of the most eventful trading days of the week.
Illustration Explanations:
- Support and Resistance Levels (thick red lines): Thick red lines indicate where movement may come to an end. Please note that these lines are not sources of trading signals.
- Kijun-sen and Senkou Span B Lines: Ichimoku indicator lines transferred from the 4-hour timeframe to the hourly timeframe. These are strong lines.
- Extreme Levels (thin red lines): Thin red lines where the price has previously bounced. These serve as sources of trading signals.
- Yellow Lines: Trendlines, trend channels, or any other technical patterns.
- Indicator 1 on COT Charts: Represents the net position size for each category of traders.