The EUR/USD currency pair experienced a slight decline on Thursday. The drop in the euro was not due to any specific event, and market volatility remained low throughout the day.
We previously discussed the Bank of England meeting in a GBP-related article. Now, it's important to note that Friday—the most significant day of the week—is approaching. We believe that Friday will bring much-needed clarity. Some may think that Trump is currently influencing the markets, which is somewhat true. However, the market will soon stop reacting to every statement he makes, as less than 20% of his comments ever materialize. While Trump stirred up the markets on Monday, he cannot continually dictate market conditions. As a result, currency instruments are starting to focus on consistent factors rather than temporary influences.
These fundamental factors remain unchanged and continue to favor the U.S. dollar. About three weeks ago, a correction began on the daily timeframe, which was expected to be significant. However, over these three weeks, the euro has fallen roughly as much as it has risen. In other words, even in conditions that favor euro appreciation, the euro has struggled to gain strength. From our perspective, this indicates that the overall decline of the European currency will likely persist. Trump has done little to support the euro; in fact, he is strongly opposed to high Federal Reserve interest rates and a strong dollar. Nevertheless, the Federal Reserve is not swayed by Trump's preferences. The Fed still anticipates 1-2 rate cuts in 2025, while the European Central Bank may lower its key rate even below the neutral 2% level. Naturally, this divergence in monetary policy does not support euro appreciation.
Another crucial factor to consider is the overall state of the European and U.S. economies. Last year, many predicted a U.S. recession; however, the latest GDP report shows a growth of 2.3%. In contrast, Europe reported a growth rate of 0%, offering no reassurance to traders. Today, key labor market and unemployment reports will be released. If these report weaker-than-expected figures, the euro may continue its essential correction, although with difficulty. Conversely, if the data proves strong again, the dollar could strengthen further—potentially leading to an early conclusion of the correction and a decline toward price parity.
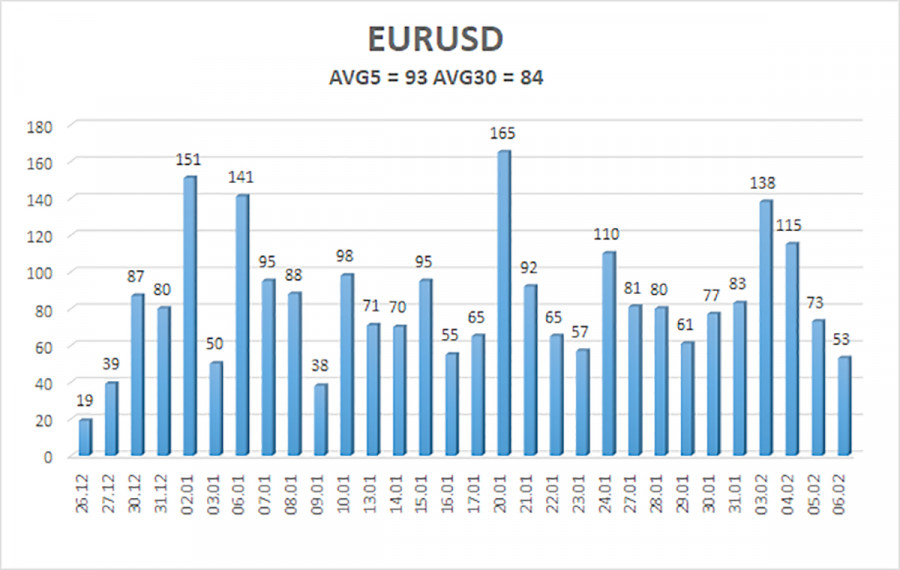
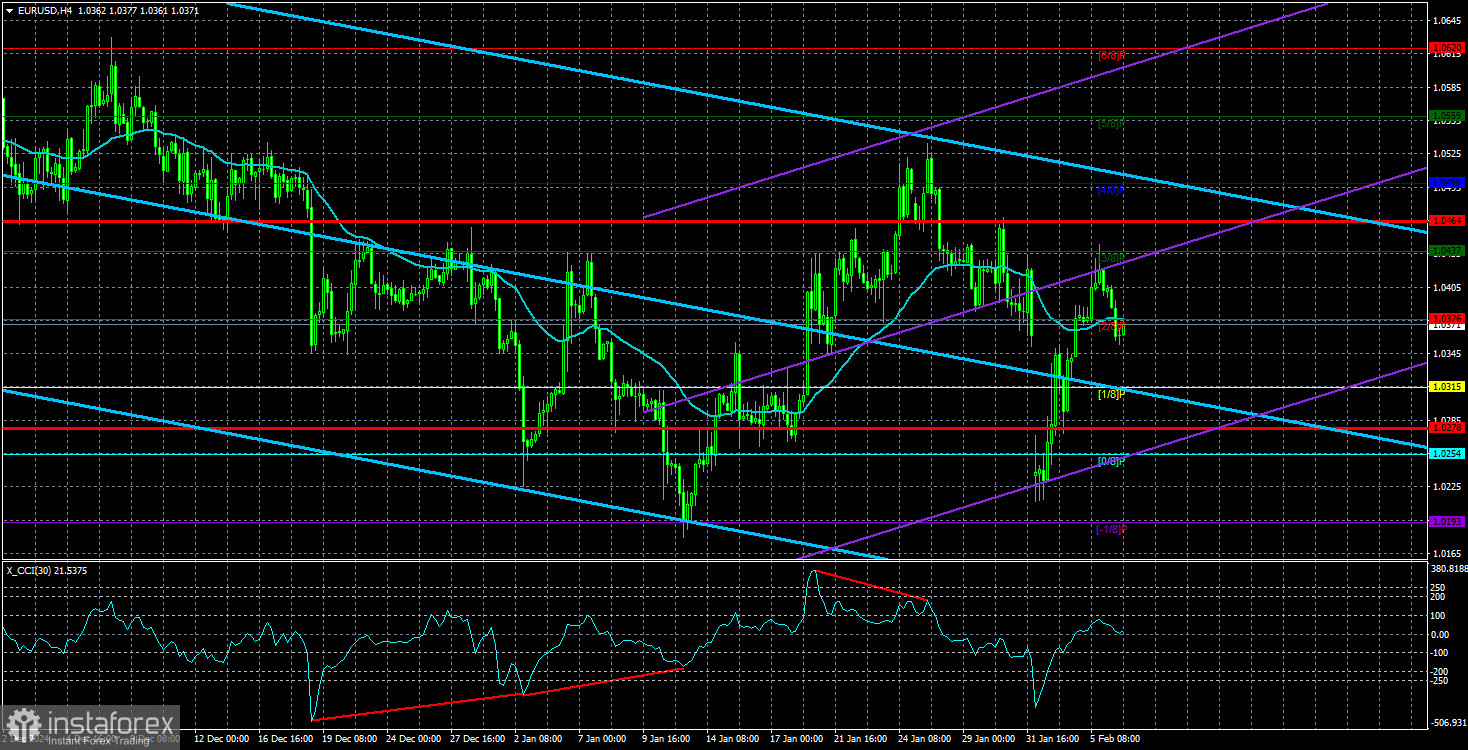
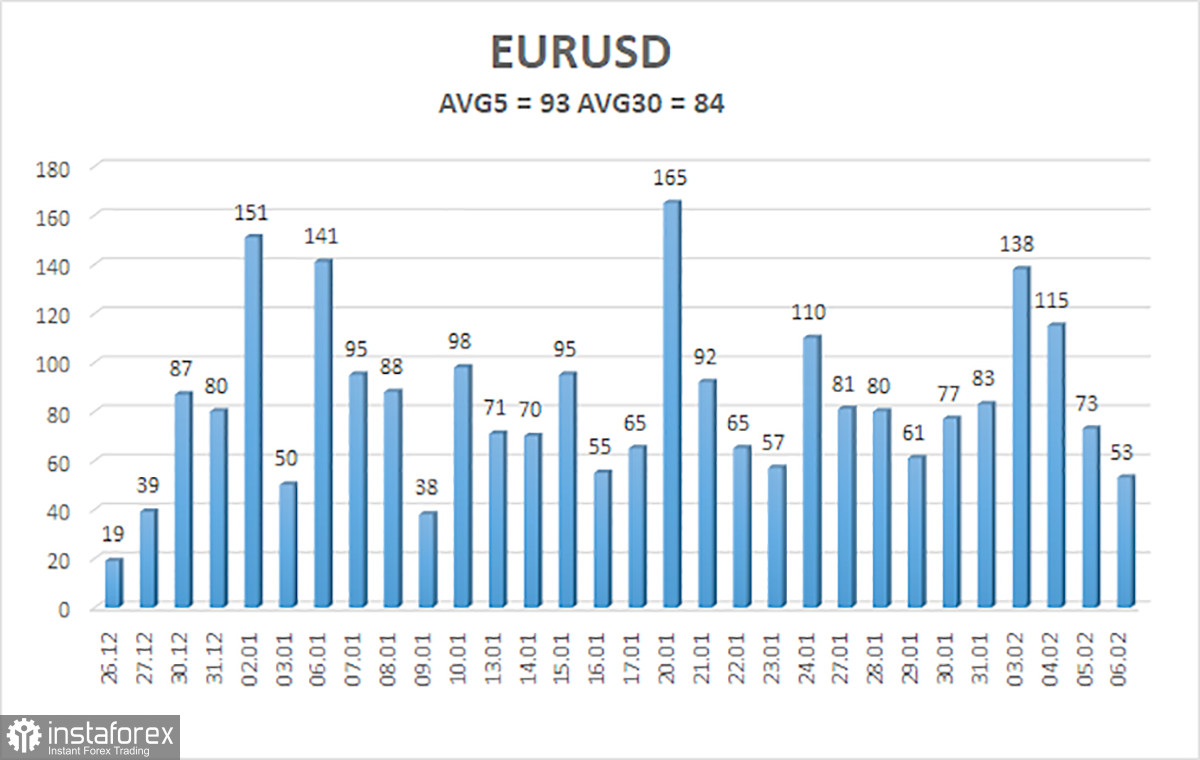
As of February 7, the average volatility of the EUR/USD currency pair over the last five trading days stands at 93 pips, which is classified as "average." We expect the pair to move between 1.0278 and 1.0464 on Friday. The higher linear regression channel remains downward-sloping, indicating that the global downtrend persists. The CCI indicator briefly entered the oversold zone before beginning a new ascent from the bottom.
Nearest Support Levels:
S1 – 1.0315
S2 – 1.0254
S3 – 1.0193
Nearest Resistance Levels:
R1 – 1.0376
R2 – 1.0437
R3 – 1.0498
Trading Recommendations:
The EUR/USD pair has sharply resumed its downward trend, followed by a brief upward retracement. Over the past few months, we have consistently indicated our expectation for the euro to decline in the medium term, and this outlook remains unchanged. The Fed has paused monetary easing, while the ECB is accelerating it. There are still no fundamental reasons for a sustained decline in the dollar, apart from purely technical corrections.
Short positions continue to be relevant, targeting levels of 1.0200 and 1.0193, although a technical correction may persist for some time. If you trade purely based on technical signals, long positions can be considered if the price rises above the moving average, with targets set at 1.0464 and 1.0498. Any upward movement is still classified as a correction on the daily timeframe.
Explanation of Illustrations:
Linear Regression Channels help determine the current trend. If both channels are aligned, it indicates a strong trend.
Moving Average Line (settings: 20,0, smoothed) defines the short-term trend and guides the trading direction.
Murray Levels act as target levels for movements and corrections.
Volatility Levels (red lines) represent the likely price range for the pair over the next 24 hours based on current volatility readings.
CCI Indicator: If it enters the oversold region (below -250) or overbought region (above +250), it signals an impending trend reversal in the opposite direction.