EUR/USD
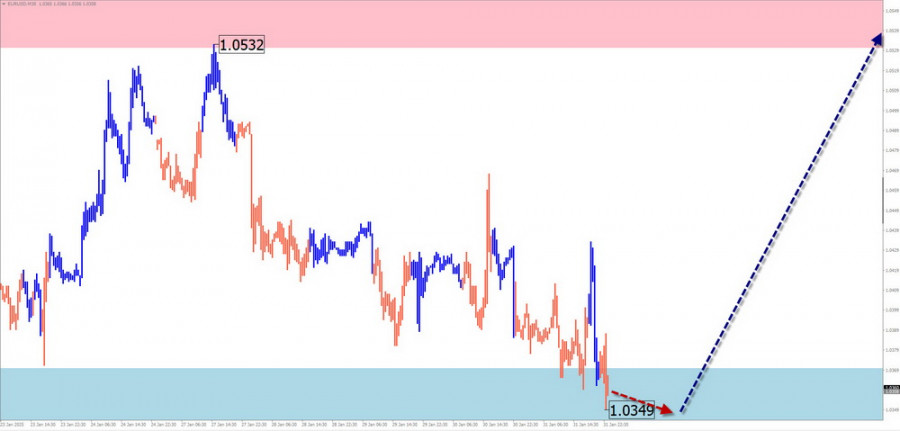
Analysis:Since October of last year, the euro's price movement has followed a downward wave algorithm. A counter-correction has been forming since the start of the year, taking the shape of an extended flat pattern, which is nearing completion. The resistance zone aligns with the lower boundary of a potential large-scale reversal zone.
Forecast:In the first half of the upcoming week, further pressure on the euro toward the support zone is likely. A pause and potential reversal may occur in this area, with a resumption of upward movement expected by the end of the week.
Potential Reversal Zones:
- Resistance: 1.0530 / 1.0580
- Support: 1.0370 / 1.0320
Recommendations:
- Buy: Consider after confirmed reversal signals near the support zone.
- Sell: No potential; likely to result in losses.
USD/JPY
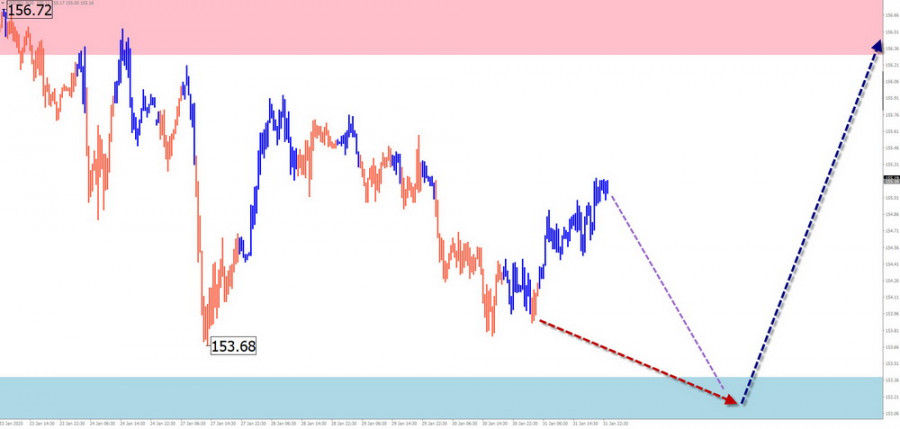
Analysis:The bullish wave for the Japanese yen began in August of last year. Since December, a counter-correction (B) has been developing, which remains incomplete at the time of analysis. Over the past week, the pair has formed a potential upward reversal wave pattern.
Forecast:In the next few days, expect a sideways movement with a gradual shift toward the support zone. The second half of the week could bring increased volatility, with a possible reversal and resumption of the uptrend.
Potential Reversal Zones:
- Resistance: 156.30 / 156.80
- Support: 153.40 / 152.90
Recommendations:
- Buy: Possible with small volume sizes after confirmed reversal signals within the support zone.
- Sell: Intraday positions with small volume sizes; close trades at the first signs of reversal.
GBP/JPY
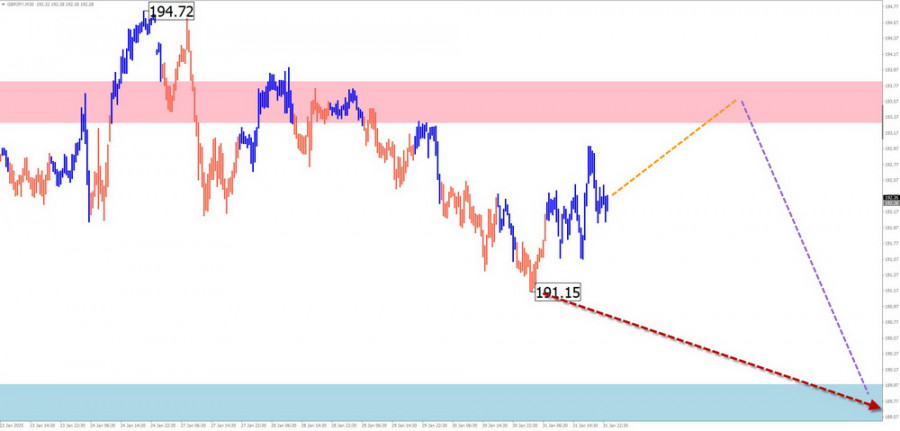
Analysis:On the GBP/JPY pair, the most notable wave for trading is the unfinished upward wave from December 3 of last year. Since January 13, the final part (C) has been forming, creating a shifting flat pattern.
Forecast:In the upcoming week, expect the pair to move sideways. A downward movement toward the support zone is possible in the first few days, with a resumption of upward momentum expected closer to the weekend.
Potential Reversal Zones:
- Resistance: 193.30 / 193.80
- Support: 191.00 / 190.50
Recommendations:
- Sell: Intraday positions with small volume sizes.
- Buy: After confirmed reversal signals in the support zone, buying becomes the priority for trading.
USD/CAD
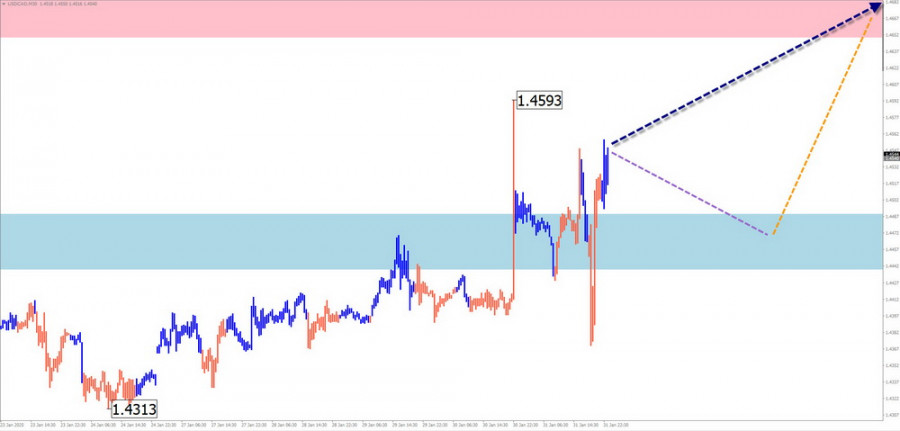
Analysis:Since late September, the uptrend in USD/CAD has followed an ascending wave algorithm. After a flat correction that ended two weeks ago, the price is now forming the final upward leg. Recently, the pair broke through strong resistance, which has now become support.
Forecast:Following a possible pullback and pressure on the support zone, a reversal and return to the general uptrend can be expected. The resistance zone marks the upper boundary of a potential weekly reversal zone.
Potential Reversal Zones:
- Resistance: 1.4650 / 1.4700
- Support: 1.4490 / 1.4440
Recommendations:
- Sell: Risky under current market conditions.
- Buy: Possible with small volume sizes after confirmed reversal signals near the support zone.
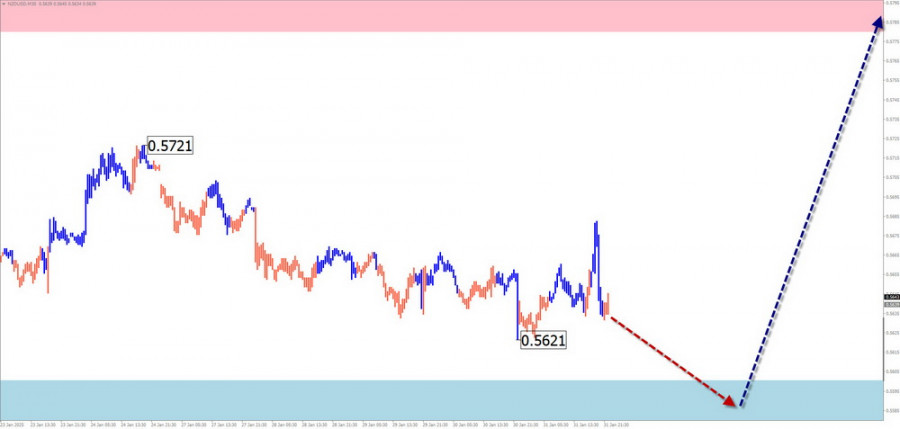
NZD/USD
Analysis:The unfinished wave structure in NZD/USD has a downward trajectory that began in mid-July last year. The corrective wave (B) started in December and remains incomplete. Prices are near the boundaries of a potential reversal zone.
Forecast:In the coming days, a reversal formation near the support zone is likely. Some downward pressure and a brief decline below support may occur, with increased activity expected closer to the weekend.
Potential Reversal Zones:
- Resistance: 0.5780 / 0.5830
- Support: 0.5600 / 0.5550
Recommendations:
- Sell: No favorable conditions expected this week.
- Buy: Possible after confirmed reversal signals near the support zone.
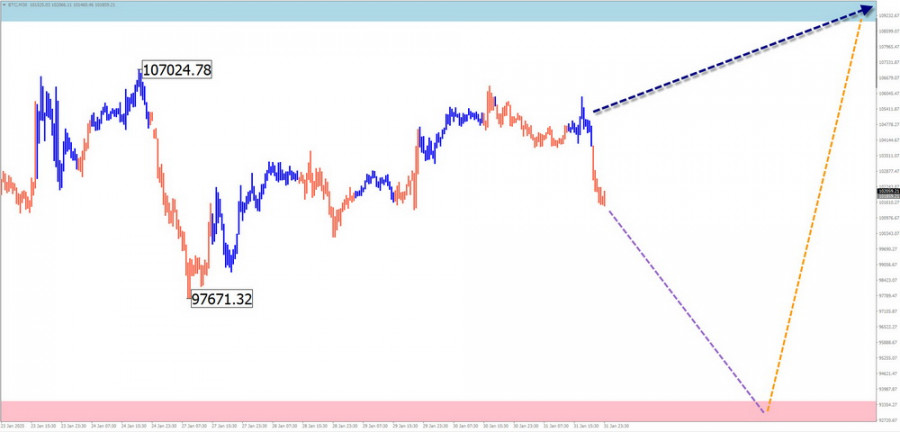
Bitcoin
Analysis:Since August of last year, Bitcoin's price fluctuations have followed an upward wave algorithm. A counter-wave (B) has been developing since mid-December, with prices moving sideways within a potential weekly reversal zone. The wave structure is not yet complete.
Forecast:At the start of the week, Bitcoin's price is likely to decline toward the support zone. After forming a reversal, expect price growth toward the resistance zone.
Potential Reversal Zones:
- Resistance: 109,000.0 / 110,000.0
- Support: 94,500.0 / 93,500.0
Recommendations:
- Sell: Possible with small volume sizes during individual sessions but with limited potential.
- Buy: Becomes relevant after confirmed reversal signals near the support zone.
Explanation:
In Simplified Wave Analysis (SWA), all waves consist of three parts (A-B-C). The last, incomplete wave is analyzed on each time frame. Dotted lines indicate expected price movements.
Note: The wave algorithm does not account for the duration of price movements over time!


