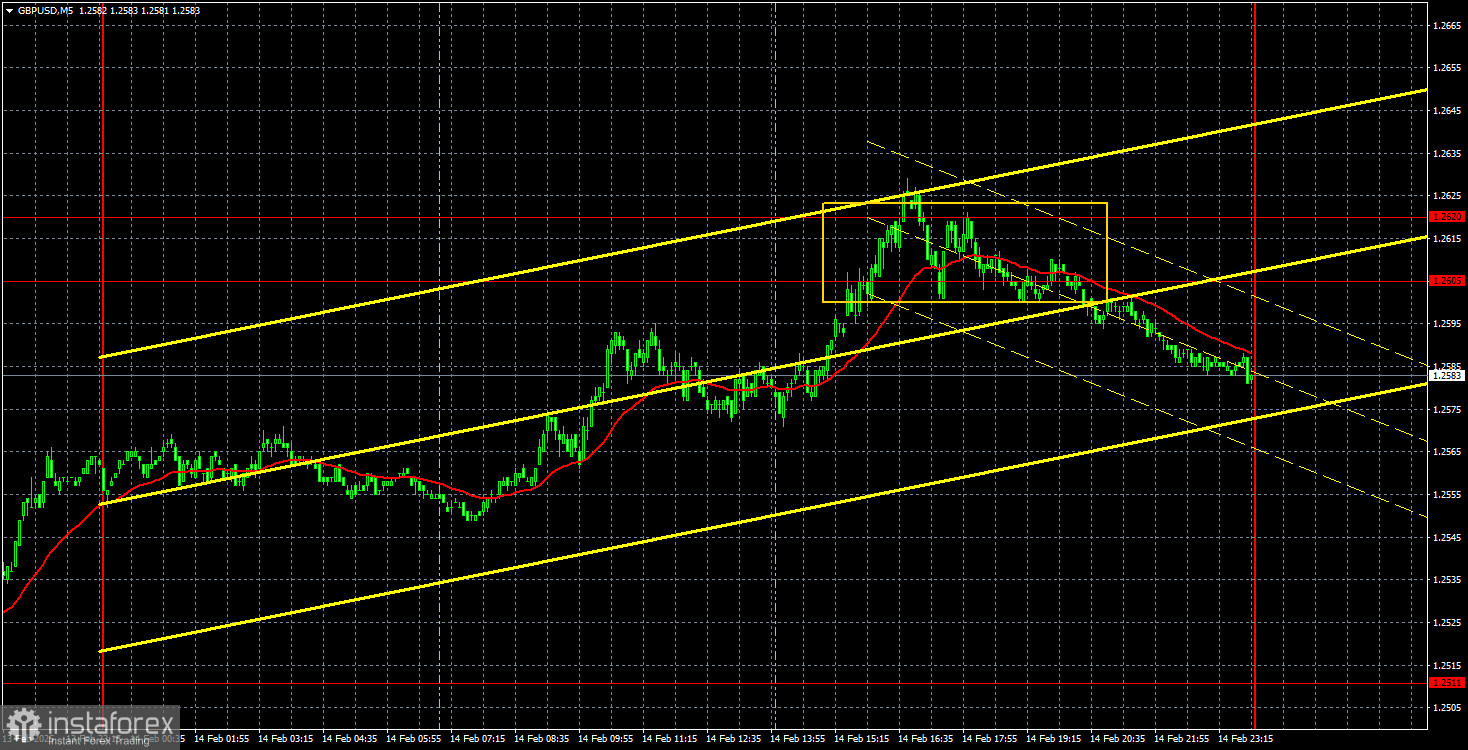
GBP/USD 5-Minute Analysis
The GBP/USD currency pair continued its upward movement on Friday. While last week's pound rally was not extremely strong, it appeared significant and almost vertical on the hourly timeframe. As mentioned, there were no strong fundamental reasons for the British currency to rise aggressively. Thus, we continue to observe an upward correction in the daily timeframe, unrelated to local macroeconomic and fundamental factors.
Since this conclusion is quite straightforward, analyzing other factors is almost unnecessary. Individual reports from the UK or the US may trigger short-term fluctuations, but the overall correction continues, and predicting each 50-60 pip move is impossible. Understanding the overall trend matters—the British pound will continue to rise as long as possible. Once the market is ready, a new wave of the four-month downtrend will begin, which is part of the 16-year bearish trend. Thus, the long-term outlook for the British pound remains uncertain, leaving little room for optimism.
Trading signals on Friday, as well as throughout last week, were far from ideal. Since the price moved in one direction most of the time, there were barely any retracements to open long positions. Only one trading signal was formed in the 1.2605–1.2620 area, but it was not the best, lacked precision, and was counter-trend. Moreover, it occurred just a couple of hours before the market closed for the weekend. The pair might continue to decline on Monday, but it is worth noting that the last two Mondays opened with gaps.
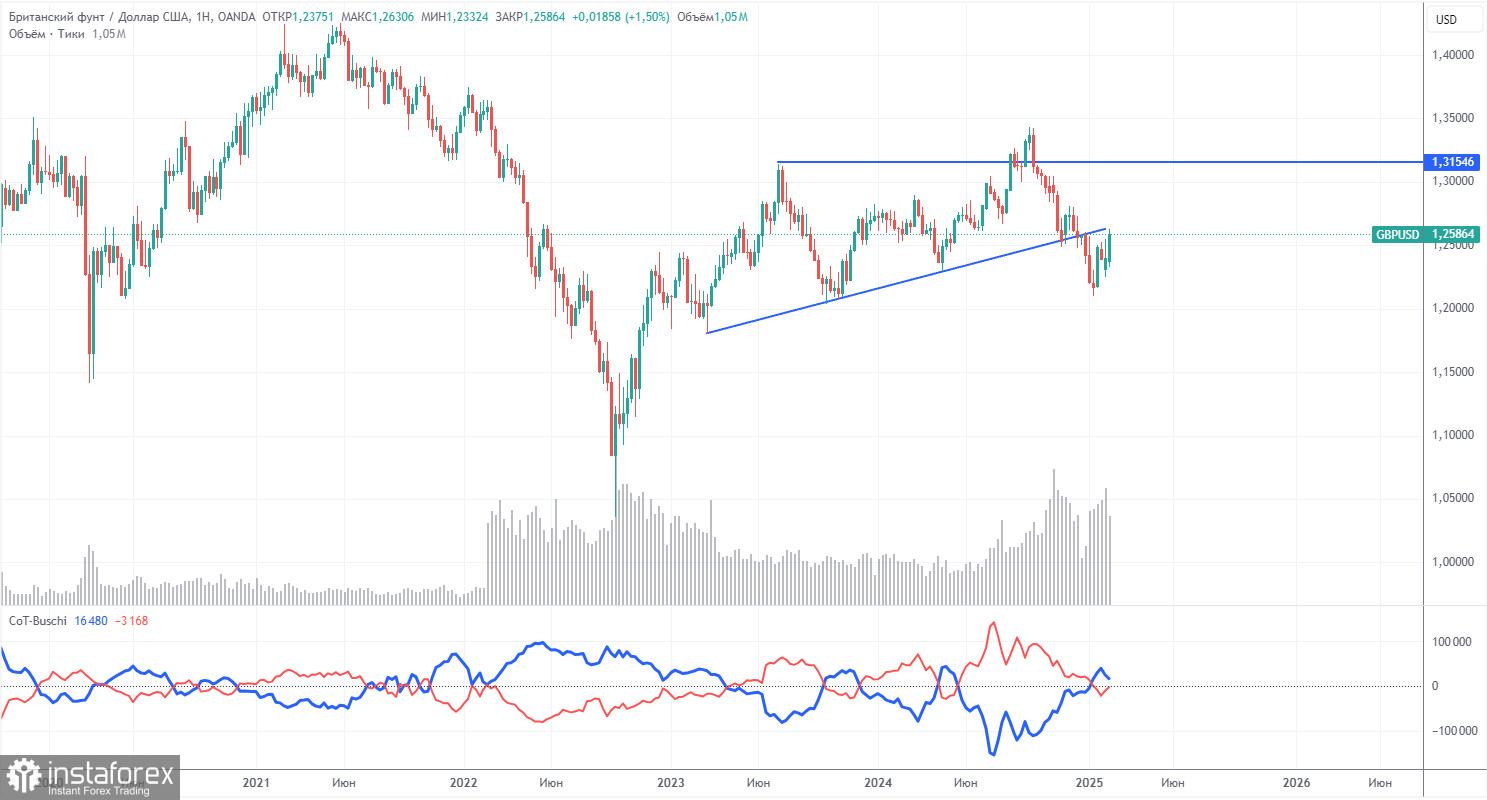
COT Report
The Commitments of Traders (COT) reports for the British pound indicate that sentiment among commercial traders has been consistently shifting over the past few years. The red and blue lines, which represent the net positions of commercial and non-commercial traders, frequently intersect and generally remain close to the zero level. Currently, these lines are near each other, suggesting that the number of buy and sell positions is almost equal.
On the weekly timeframe, the price initially broke through the 1.3154 level before dropping to the trendline, which it subsequently breached. This break of the trendline strongly suggests that the pound's decline is likely to continue. However, there was also a rebound from the previous local low on the weekly timeframe, indicating that the currency pair may be experiencing a flat.
According to the latest COT report, the Non-commercial group opened 3,600 buy contracts and closed 4,500 sell contracts, resulting in an increase of 8,100 in net positions. However, this shift does not provide any substantial support for the pound.
The fundamental backdrop still does not justify long-term purchases of the pound, and the currency has a real chance of continuing its global downtrend. As such, net positions may continue to decline, signaling a potential further drop in demand for the British pound.
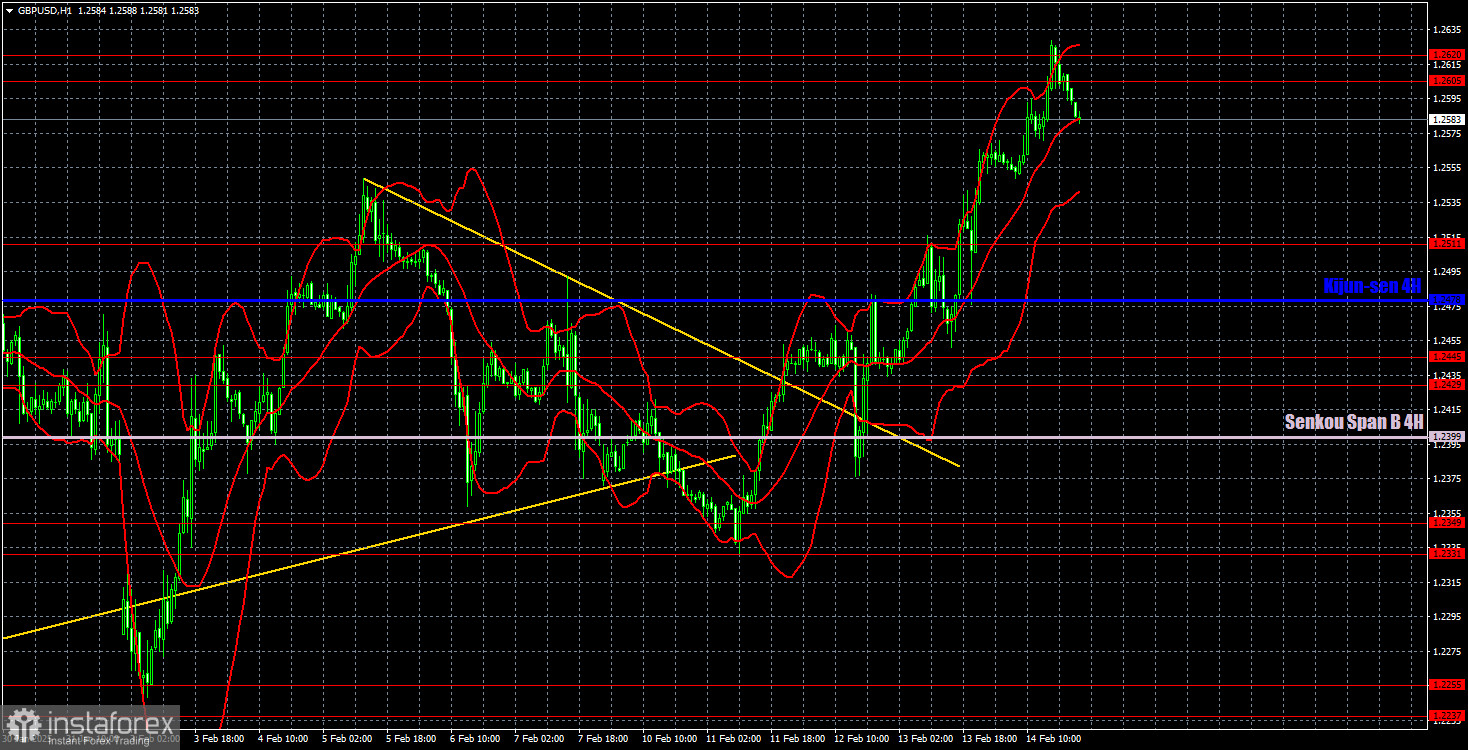
GBP/USD 1-Hour Analysis
The GBP/USD pair has now completed a short-term downtrend on the hourly timeframe. However, this may not be the last trend shift in this cycle. We still do not see a solid foundation for sustained pound growth, especially in the long term. We would not recommend long positions on higher timeframes and in a broader perspective. The pound's fundamental position remains weak, and its gains are purely corrective.
For February 17, the key trading levels are 1.2052, 1.2109, 1.2237-1.2255, 1.2331-1.2349, 1.2429-1.2445, 1.2511, 1.2605-1.2620, 1.2691-1.2701, and 1.2796-1.2816. The Senko Span B line (1.2399) and Kijun-sen line (1.2478) can also act as potential trading signals. Setting a Stop Loss at breakeven once the price moves 20 pips in the correct direction is recommended, helping to mitigate potential losses in case of a false signal.
There are no scheduled significant economic events or reports in the UK or the US on Monday. Therefore, we do not expect continued pound appreciation or strong market movements today. However, unexpected policy decisions from Donald Trump remain a wildcard that could introduce market volatility.
Illustration Explanations:
- Support and Resistance Levels (thick red lines): Thick red lines indicate where movement may come to an end. Please note that these lines are not sources of trading signals.
- Kijun-sen and Senkou Span B Lines: Ichimoku indicator lines transferred from the 4-hour timeframe to the hourly timeframe. These are strong lines.
- Extreme Levels (thin red lines): Thin red lines where the price has previously bounced. These serve as sources of trading signals.
- Yellow Lines: Trendlines, trend channels, or any other technical patterns.
- Indicator 1 on COT Charts: Represents the net position size for each category of traders.