empty
21.08.2024 01:39 PM
EUR/USD. August 21st. An empty calendar does not confuse traders

On Tuesday, the EUR/USD pair continued its upward movement after consolidating above the 1.1070–1.1081 zone. The upward movement in the pair's value continues on Wednesday within the upward trend channel, and the pair has a realistic chance of reaching the 200.0% corrective level at 1.1164 as early as today. The first signs of a retreat by the bulls will appear if the pair closes below the trend channel. The second sign will appear after a consolidation below the support zone of 1.1070–1.1081. However, even in this case, the growth of the U.S. dollar will be limited by the upward trendline.

This image is no longer relevant

The wave structure has become a bit more complicated, but it remains clear overall. The last completed downward wave did not break the low of the previous wave, while the new upward wave has broken the peak from August 14. Thus, the "bullish" trend is still intact. For the "bullish" trend to be nullified, the bears now need to break the low of the last downward wave, which is near the 1.0950 level.

The news background on Tuesday was extremely weak, but this did not deter the bullish traders. Throughout the day, we saw steady euro purchases once again. I maintain my opinion that bullish traders continue to drive the market based on expectations of an FOMC rate cut and Jerome Powell's speech at the Jackson Hole symposium at the end of the week. Whether this is truly the reason or not remains an open question. However, I see no other reasons for such a strong decline in the U.S. dollar. I also don't find it logical, as traders have been offloading the dollar almost every day. The Fed will undoubtedly cut rates in September, but no one knows what will happen next. If inflation accelerates again in August, September, or October, will the Fed cut rates in November and December? In my view, the market is once again too optimistic and is getting ahead of itself. There aren't enough factors right now to justify selling the dollar every day.

This image is no longer relevant

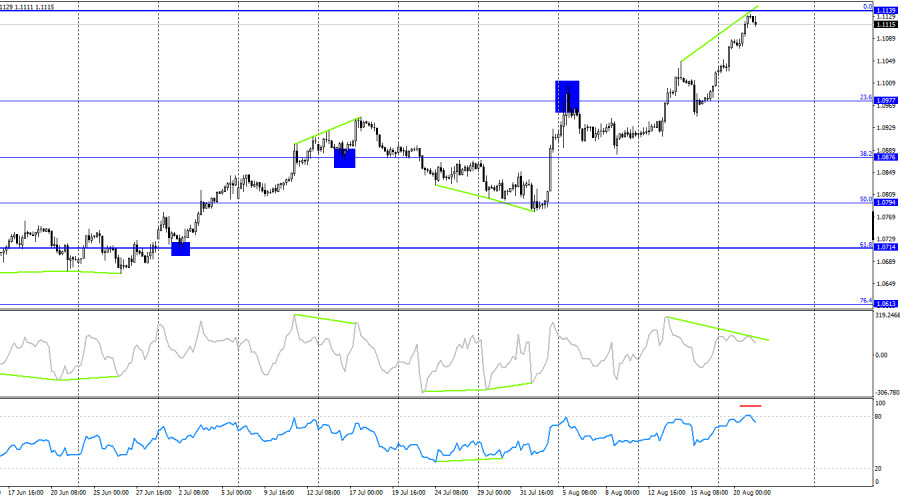
On the 4-hour chart, the pair has risen to the 0.0% Fibonacci level at 1.1139. A rebound from this level could signal a reversal in favor of the U.S. dollar and a potential decline towards the 23.6% corrective level at 1.0977. The CCI has been signaling a "bearish" divergence for several days, and the RSI is in overbought territory. Thus, there are many factors indicating a potential decline in the pair by the end of the week. However, is strong growth in the dollar likely at this time? In my opinion, no. Even if a downward trend begins, it will take quite some time to gather the necessary confirmations.

Commitments of Traders (COT) Report:

This image is no longer relevant

During the last reporting week, speculators closed 3,587 long positions and opened 3,010 short positions. The sentiment of the Non-commercial group turned bearish several months ago, but bulls are once again dominant. The total number of long positions held by speculators now stands at 182,000, while short positions total 155,000.

I still believe that the situation will continue to shift in favor of the bears. I don't see long-term reasons to buy the euro, as the ECB has begun easing monetary policy, which will lower the yields on bank deposits and government bonds. In the U.S., they will remain at high levels at least until September, making the dollar more attractive to investors. The potential for a decline in the euro appears significant. However, it is important to keep in mind the technical analysis, which currently does not strongly indicate a significant drop in the euro, as well as the news background, which consistently "throws a wrench" into the dollar's performance.

News Calendar for the U.S. and Eurozone:

U.S. – Release of FOMC Minutes (18:00 UTC).

On August 21, the economic calendar contains only one event. The influence of the news on trader sentiment today will be very weak.

Forecast for EUR/USD and Trading Advice:

Selling the pair today can be considered on a rebound from the 1.1139 level on the 4-hour chart with a target of 1.0977. Purchases were possible on a close above the 1.1080 level on the hourly chart with a target of 1.1140. This target is almost reached. I would approach new purchases with caution.

Fibonacci levels are plotted between 1.0917–1.0668 on the hourly chart and between 1.0450–1.1139 on the 4-hour chart.

Samir Klishi,
Analytical expert of InstaForex
© 2007-2025
Select timeframe
5
min
15
min
30
min
1
hour
4
hours
1
day
1
week
Earn on cryptocurrency rate changes with InstaForex
Download MetaTrader 4 and open your first trade
  • Grand Choice
    Contest by
    InstaForex
    InstaForex always strives to help you
    fulfill your biggest dreams.
    JOIN CONTEST

Recommended Stories

EUR/USD. Fed Meeting Results May Lead the Pair to a Decline

The pair is consolidating in a narrow range below the resistance level of 1.1345 in anticipation of the outcome of the Fed's monetary policy meeting, which will conclude on Wednesday

Pati Gani 10:59 2025-05-05 UTC+2

EUR/USD – May 5th: The U.S. Labor Market Is Not Hopeless

On Friday, the EUR/USD pair rose to the level of 1.1374, bounced off, and reversed in favor of the U.S. dollar. The bears attacked again, but only briefly, and overall

Samir Klishi 10:57 2025-05-05 UTC+2

GBP/USD – May 5: Trump May Lift Tariffs on China

On the hourly chart, the GBP/USD pair continued its decline on Friday toward the 161.8% Fibonacci correction level at 1.3249. A rebound from this level will favor the British pound

Samir Klishi 10:51 2025-05-05 UTC+2

Forex forecast 05/05/2025: EUR/USD, GBP/USD, USD/JPY, USD/CHF, USD/CAD and Bitcoin

Useful links: My other articles are available in this section InstaForex course for beginners Popular Analytics Open trading account Important: The begginers in forex trading need to be very careful

Sebastian Seliga 10:23 2025-05-05 UTC+2

Technical Analysis of Intraday Price Movement of Gold Commodity Instrument, Monday May 05, 2025.

With the appearance of the Failing Wedge pattern on the 4-hour chart, it gives an indication that in the near future it has the potential to go to the level

Arief Makmur 08:23 2025-05-05 UTC+2

Technical Analysis of Intraday Price Movement of EUR/JPY Cross Currency Pairs, Monday May 05, 2025.

By looking at the 4-hour chart of the EUR/JPY cross currency pair, it appears that in the near future EUR/JPY has the potential to strengthen, which is confirmed

Arief Makmur 08:23 2025-05-05 UTC+2

Technical Analysis of Intraday Price Movement Nasdaq 100 Index, Friday May 02, 2025.

From what is seen on the 4-hour chart of the Nasdaq 100 index, the Stochastic Oscillator indicator is in a Crossing SELL condition and the appearance of a Rising Wedge

Arief Makmur 08:04 2025-05-02 UTC+2

Trading Signals for GOLD (XAU/USD) for May 1-3, 2025: buy above $3,203 (200 EMA - 5/8 Murray)

The price of the yellow metal is likely to trade between 3,203 and could reach the bottom of the bearish channel around 3,181 in the coming days, a level that

Dimitrios Zappas 17:49 2025-05-01 UTC+2

Trading Signals for EUR/USD for April 30, 2025: sell below 1.1376 (21 SMA - 7/8 Murray)

Early in the American session, the EUR/USD pair is trading around 1.1378 within the downtrend channel formed on April 17 and showing signs of exhaustion of bullish strength. A technical

Dimitrios Zappas 17:37 2025-04-30 UTC+2

Forex forecast 30/04/2025: EUR/USD, AUD/USD, USD/JPY, Gold, and Bitcoin

Useful links: My other articles are available in this section InstaForex course for beginners Popular Analytics Open trading account Important: The begginers in forex trading need to be very careful

Sebastian Seliga 16:31 2025-04-30 UTC+2
Can't speak right now?
Ask your question in the chat.
Widget callback
 

Dear visitor,

Your IP address shows that you are currently located in the USA. If you are a resident of the United States, you are prohibited from using the services of InstaFintech Group including online trading, online transfers, deposit/withdrawal of funds, etc.

If you think you are seeing this message by mistake and your location is not the US, kindly proceed to the website. Otherwise, you must leave the website in order to comply with government restrictions.

Why does your IP address show your location as the USA?

  • - you are using a VPN provided by a hosting company based in the United States;
  • - your IP does not have proper WHOIS records;
  • - an error occurred in the WHOIS geolocation database.

Please confirm whether you are a US resident or not by clicking the relevant button below. If you choose the wrong option, being a US resident, you will not be able to open an account with InstaForex anyway.

We are sorry for any inconvenience caused by this message.