empty
13.11.2023 06:29 AM
EUR/USD and GBP/USD: Technical analysis for November 13

EUR/USD

This image is no longer relevant

Higher Timeframes

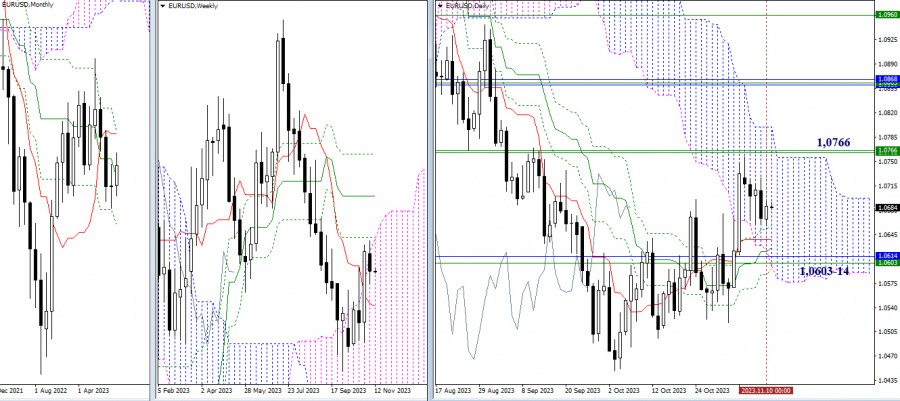
The confirmation and development of the bullish sentiment did not succeed. The entire past week was occupied by a decrease and consolidation. As a result, the pair remained within the boundaries, breaking which could help change the current situation and provide new prospects for continued movement. At the moment, the market from above is limited by the accumulation of resistances around 1.0766 (weekly levels + upper boundary of the daily cloud), and below, its supports, except for the daily Ichimoku cross (1.0657 – 1.0638 – 1.0627 – 1.0588), include the weekly short-term trend (1.0603) and the monthly medium-term trend (1.0614).

This image is no longer relevant

H4 – H1

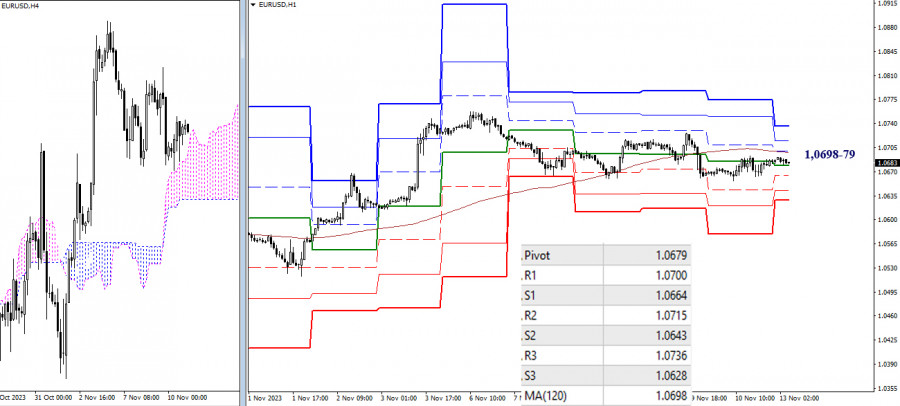
On lower timeframes, the market continues to be constrained by key levels, currently consolidating efforts around 1.0698-79 (central pivot point + weekly long-term trend). The prolonged lack of directional movement indicates uncertainty and a wait-and-see position, although the main advantage remains on the bears' side. Intraday bearish targets today can be marked at 1.0664 – 1.0643 – 1.0628 (supports of classic pivot points). Consolidation above 1.0698-79 and a reversal of the movement can change the current balance of power on the lower timeframes. And for further strengthening of bullish sentiment, players will need to overcome the resistances R2 (1.0715) and R3 (1.0736) of classic pivot points.

***

GBP/USD

This image is no longer relevant

Higher timeframes

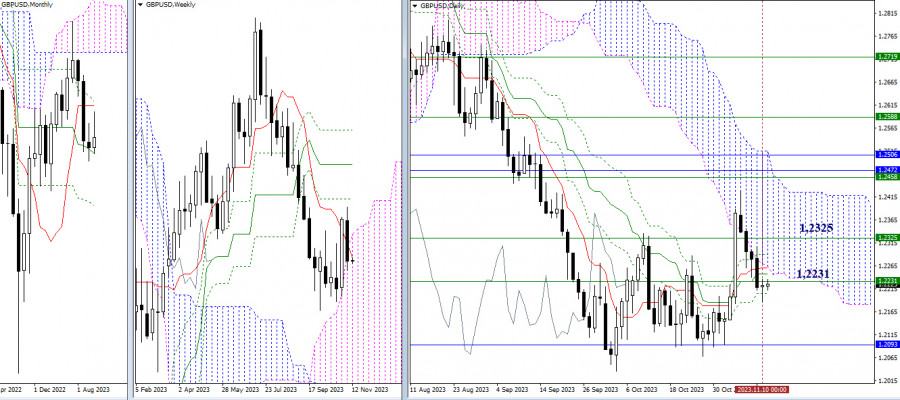
Last week, bears could not completely neutralize all the previous achievements of the opponent. Nevertheless, they managed to decline below many current supports, so all the nearest levels (1.2231 – 1.2248 – 1.2260 – 1.2264 – 1.2290 – 1.2325) passed last week are now transformed into resistances, playing the role of top-priority tasks for bulls to restore their positions. For bears, it is still important to eliminate the daily Ichimoku cross (1.2205), overcome the support of the monthly medium-term trend (1.2093), and restore the downward trend (1.2036).

This image is no longer relevant

H4 – H1

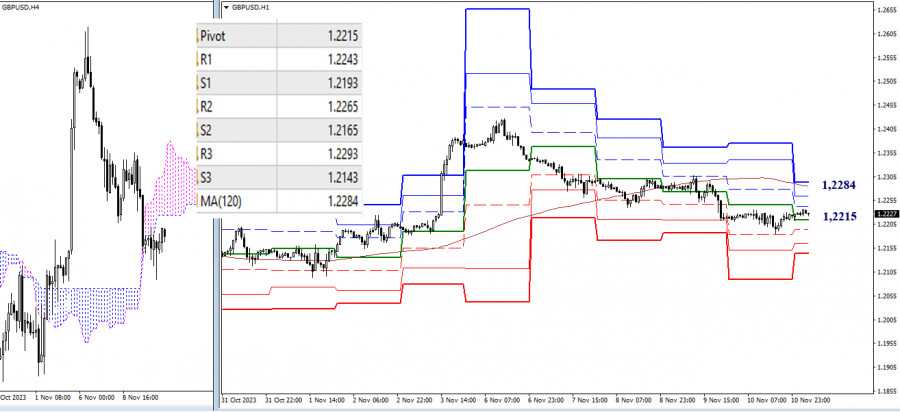
At the moment, bears have the main advantage. To change the situation, bulls need to rise and consolidate above the weekly long-term trend (1.2284), turning the movement in their favor. Intraday bearish targets during the continuation of the decline today will encounter the market at 1.2215 – 1.2193 – 1.2165 – 1.2143 (classic pivot points).

***

The technical analysis of the situation uses:

Higher timeframes - Ichimoku Kinko Hyo (9.26.52) + Fibonacci Kijun levels

Lower timeframes - H1 - Pivot Points (classic) + Moving Average 120 (weekly long-term trend)

Evangelos Poulakis,
الخبير التحليلي لدى شركة إنستافوركس
© 2007-2025
حدد الإطار الزمني
5
د
15
د
30
د
1
س
4
ساعات
1
يوم
1
أسبوع
كسب عائد من تغيرات أسعار العملات المشفرة مع إنستافوركس.
قم بتحميل منصة التداول ميتاتريدر 4 وافتح أول صفقة.
  • Grand Choice
    Contest by
    InstaForex
    InstaForex always strives to help you
    fulfill your biggest dreams.
    انضم إلى المسابقة

المقالات الموصى بها

اليورو/الدولار الأمريكي. 6 مايو. الدببة فعلوا كل ما بوسعهم

يوم الاثنين، قام زوج اليورو/الدولار الأمريكي بانعكاس جديد لصالح الدولار الأمريكي، ولكن هذه المرة كان الانخفاض أضعف. خلال معظم الأسبوع الماضي، شن الدببة هجمات بطيئة، حيث تم التصدي لها بخلفية

Samir Klishi 10:30 2025-05-06 UTC+2

GBP/USD. 6 مايو. حصلت الصين على ما تستحقه

في الرسم البياني لكل ساعة، استمر زوج الجنيه الإسترليني/الدولار الأمريكي في التداول بشكل جانبي يوم الاثنين. بدأ هذا التحرك الجانبي الأسبوع الماضي عندما تم إصدار سلسلة من التقارير المهمة

Samir Klishi 10:25 2025-05-06 UTC+2

التحليل الفني لحركة السعر اللحظية لأزواج العملات المتقاطعة GBP/AUD، الثلاثاء 6 مايو 2025.

على الرسم البياني لمدة 4 ساعات، يبدو أن زوج العملات المتقاطع GBP/AUD لا يزال تحت سيطرة البائعين، وهو ما تؤكده حركة السعر التي تتحرك تحت WMA (30 Shift 2)، ولكن

Arief Makmur 10:17 2025-05-06 UTC+2

التحليل الفني لحركة السعر اللحظية لأداة سلعة النفط الخام، الثلاثاء 6 مايو 2025.

مع تشكيل حركة السعر لقاع أعلى - قاع أدنى وبدعم من انخفاض ميل WMA (30 Shift 2) وحركة أسعار النفط الخام التي تتحرك أدناه، من الواضح أن البائعين يسيطرون بشكل

Arief Makmur 10:16 2025-05-06 UTC+2

إشارات التداول لليورو/الدولار الأمريكي للفترة من 5 إلى 8 مايو 2025: بيع تحت 1.1370 (200 EMA - 6/8 Murray)

في بداية الجلسة الأمريكية، يتداول زوج اليورو/الدولار الأمريكي حول مستوى 1.1345، ليصل إلى قمة قناة الاتجاه الهابط ويظهر علامات على الإرهاق. يمكن لليورو أن يستأنف دورته الهبوطية إذا استقر

Dimitrios Zappas 17:34 2025-05-05 UTC+2

إشارات التداول للذهب (XAU/USD) للفترة من 5 إلى 8 مايو 2025: الشراء فوق $3,305 (21 SMA - 7/8 Murray)

من ناحية أخرى، قد يؤدي ضعف المعدن تحت المتوسط المتحرك البسيط لـ 21 يومًا عند 3,280 إلى استئناف الدورة الهبوطية. لذا، يمكننا توقع وصول الذهب إلى قاع قناة الاتجاه الهابط

Dimitrios Zappas 17:31 2025-05-05 UTC+2

اليورو/الدولار الأمريكي. نتائج اجتماع الفيدرالي قد تؤدي إلى تراجع الزوج

يتحرك الزوج في نطاق ضيق تحت مستوى المقاومة 1.1345 في انتظار نتائج اجتماع السياسة النقدية للاحتياطي الفيدرالي، والذي سيختتم يوم الأربعاء، 7 مايو. إذا قرر الاحتياطي الفيدرالي الإبقاء

Pati Gani 10:59 2025-05-05 UTC+2

اليورو/الدولار الأمريكي – 5 مايو: سوق العمل الأمريكي ليس ميؤوسًا منه

يوم الجمعة، ارتفع زوج اليورو/الدولار الأمريكي إلى مستوى 1.1374، ثم ارتد وعكس الاتجاه لصالح الدولار الأمريكي. هاجم الدببة مرة أخرى، ولكن لفترة وجيزة فقط، وبشكل عام ظلوا ضعفاء

Samir Klishi 10:57 2025-05-05 UTC+2

GBP/USD – 5 مايو: ترامب قد يرفع التعريفات الجمركية على الصين

على الرسم البياني الساعي، واصل زوج الجنيه الإسترليني/الدولار الأمريكي تراجعه يوم الجمعة نحو مستوى تصحيح فيبوناتشي 161.8% عند 1.3249. الارتداد من هذا المستوى سيفضل الجنيه الإسترليني وقد يؤدي

Samir Klishi 10:51 2025-05-05 UTC+2

توقعات الفوركس 05/05/2025: اليورو/الدولار الأمريكي، الجنيه الإسترليني/الدولار الأمريكي، الدولار الأمريكي/الين الياباني، الدولار الأمريكي/الفرنك السويسري، الدولار الأمريكي/الدولار الكندي وبيتكوين

روابط مفيدة: مقالاتي الأخرى متوفرة في هذا القسم دورة InstaForex للمبتدئين التحليلات الشائعة افتح حساب تداول مهم: يجب على المبتدئين في تداول الفوركس أن يكونوا حذرين للغاية عند اتخاذ القرارات

Sebastian Seliga 10:23 2025-05-05 UTC+2
لا تستطيع التحدث الآن؟
اطرح سؤالك في الدردشة.
Widget callback
 

Dear visitor,

Your IP address shows that you are currently located in the USA. If you are a resident of the United States, you are prohibited from using the services of InstaFintech Group including online trading, online transfers, deposit/withdrawal of funds, etc.

If you think you are seeing this message by mistake and your location is not the US, kindly proceed to the website. Otherwise, you must leave the website in order to comply with government restrictions.

Why does your IP address show your location as the USA?

  • - you are using a VPN provided by a hosting company based in the United States;
  • - your IP does not have proper WHOIS records;
  • - an error occurred in the WHOIS geolocation database.

Please confirm whether you are a US resident or not by clicking the relevant button below. If you choose the wrong option, being a US resident, you will not be able to open an account with InstaForex anyway.

We are sorry for any inconvenience caused by this message.